Download
1 / 15
150 likes | 152 Vues
This article explores the current status and future plans for pipelines in Ohio, highlighting the significant impact on land use, carbon emissions, and potential environmental and health risks. The build-out of pipelines raises concerns about energy independence versus energy arbitrage and the potential loss of ecosystem services.

E N D
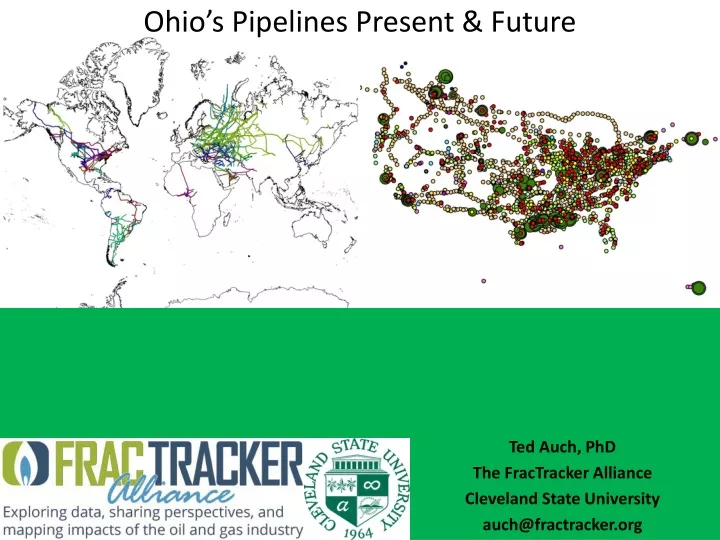
Ohio’s Pipelines Present & Future Ted Auch, PhD The FracTracker Alliance Cleveland State University auch@fractracker.org
Regional Connections • Nationally • 34K pipelines (range <1-302 miles); averaging 6 miles in length • 195,989 miles total • Ohio • 890 unique pipelines (<1-137 miles in length) totaling 6,411 miles (average 7.2 miles) • 6,527 acres of forest and 19,582 acres of agricultural land
Regional Connections • Nationally • 34K pipelines (range <1-302 miles); avg 6 miles in length • 195,989 miles total (49% increase proposed or being built)
Regional Connections • 22,127 miles of Midwest pipeline proposals (105 unique segments; range 1-1,056 miles) averaging 211 miles in length • In Ohio • 37 of these segments pass through Ohio (range 3.5-317 miles); averaging 118 miles in length • 4,380 miles total or 1/5th of the proposed pipeline length • This would amount to 22,298 acres of disturbance • 4,460 acres of forest, 8,000 acres of crops, 5,400 acres of hay/pasture, and 1,780 acres of grasslands • Forest would loss 9.5 MT Carbon (6.2-15.9 MT) or 3.3 million Ohioans worth of CO2 • Potential ecosystem services, watershed resilience, water/air quality issues rise in parallel.
Global Connections • Build-out of pipelines is not geared towards “energy independence” but rather “energy arbitrage”
What We’ve Learned from Hoover Grant • Spring 2014 – 511 mi2 across Columbiana, Carroll, and Stark (30*30 cm resolution)
What We’ve Learned from Mt. Union/Hoover Grant • Limits of Disturbance (LOD) – we define this as pad plus disturbed area; 9.63 acres ± 4.89; range of 4.89-38.8 • 11,324 acres; 5,751-45,629 acres • Land-Use - 2,265 ac. forest; 4,076 ac. crops; 2,717 ac. pasture; 906 ac. grassland • 122 Well Pads – Averaging 4.5 acres ± 0.49; range between 1.9 and 5.2 acres
What We’ve Learned from Hoover Grant • Total footprint excluding roads and retention ponds – 2,328 acres with the ratio of pipelines to well pads being 3.3:1 • 306 miles of new pipelines – average width of 42 feet ± 14.1 feet; 1,779 acres of disturbance
What We’ve Learned from Bradford County, PA • 306 unique pipeline segments – average length of 3.5 miles ± 4.6 miles; range of 0.26-47.64 miles • 1,070 miles of pipelines or 0.93 miles of pipeline per mi2
The EQT & TETCO Proposals • 28 unique pipeline segments – average length of 27 miles; range of 0.96-104 miles • 751 miles of pipelines or 0.04 miles of pipeline per mi2
The MarkWest Proposals • 63 unique pipeline segments – average length of 19 miles; range of 2.2-113 miles • 1,197 miles of pipelines or 0.08 miles of pipeline per mi2
The MarkWest Proposals • Nearly 10,200 polygons • Average 3.3 acres of disturbance per segment; high of 2.6 mi2; total of 53 mi2 • 1,676 forested segments; 12.4 ac. Average and a total of 32.5 mi2 of forest removal for this proposal • 13.1 mi2 of agriculture; 5.3 mi2 of developed; 33 acres of wetlands; 236 acres of open water traversed; 580 acres of grassland • Forest displacement would remove 580,545 tons of Carbon (426-1,095K) • This is equivalent to 30.3 tons of CO2 (22.2-57.1 MT CO2) • Amounts to the emissions of 1.69 million Ohioans (1.24-3.18 million Ohioans)
Secondary & Tertiary Facilities • 1,948 miles of new pipelines • 16 mi2 of disturbance associated with these two projects • 2.1K acres of forest, 3.8K acres of crops, 2.5K acres of hay/pasture, and 819 acres of grassland • For every 22 miles of pipeline proposed we see at least 1 facility needed • Fractionator, Regulator Station, Compressor Station, Processing Plant, Delivery Point, etc
Forest Conclusions Agriculture Wetlands/Grasslands Developed
Conclusions • The build-out of hydrocarbon pipelines: • Increases likelihood that “energy independence” was just cover for arbitrage and global export • The proposal trend dwarfs the current inventory of pipelines • Increases likelihood of many small environmental/health events many of which will go undocumented • Increased environmental/health risk connectivity (Ex. Bradford County) • Further fragments landscape and dwarfs land-use/land-cover (LULC) associated with well pads • The potential loss of ecosystem services and watershed resilience is nontrivial • 1.7 Million Ohioans worth of CO2 emissions (1.3-3.3 million)