Download
1 / 29
290 likes | 432 Vues
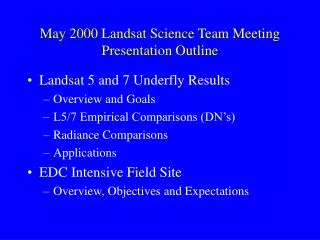
May 2000 Landsat Science Team Meeting Presentation Outline. Landsat 5 and 7 Underfly Results Overview and Goals L5/7 Empirical Comparisons (DN’s) Radiance Comparisons Applications EDC Intensive Field Site Overview, Objectives and Expectations.

E N D
May 2000 Landsat Science Team Meeting Presentation Outline • Landsat 5 and 7 Underfly Results • Overview and Goals • L5/7 Empirical Comparisons (DN’s) • Radiance Comparisons • Applications • EDC Intensive Field Site • Overview, Objectives and Expectations
The L5/L7 Underfly Cross-Calibration ExperimentOverview of the Underfly • One-Time Opportunity During L7 OIV to Collect Nearly-Coincident L5 TM and L7 ETM+ Data • Significant Resource for Cross-Calibrating L7 ETM+ to L5 TM (and Vice-Versa) • 30 Orbits From 21:44:40 GMT on 1 June 1999 to 23:05:16 GMT on 3 June 1999 • Approximately 750 Scenes Acquired Over Africa, Australia, Europe, North America, and South America • TM Data Acquired by L4/5 IGS Network • ETM+ Data Acquired by NASA/USGS L7 Ground Network
ACRES Alice Springs, Australia CONAE Cordoba, Argentina INPE Cuiaba, Brazil ESA Fucino, Italy Kiruna, Sweden CCRS Gatineau, Quebec, Canada Prince Albert, Saskatchewan, Canada DLR Libreville, Gabon SAC Johannesburg, South Africa Space Imaging/EOSAT Norman, Oklahoma, USA KACST Riyadh, Saudi Arabia The L5/L7 Underfly Cross-Calibration ExperimentParticipating Stations
The L5/L7 Underfly Cross-Calibration ExperimentParticipating Station Footprints
The L5/L7 Underfly Cross-Calibration ExperimentData Acquisition Coverage Map
Underfly Data Sets • Niobrara, NE; June 2, 1999 (Path/Row 31/30) • Western Michigan; June 3, 1999 (Path/Row 22/29) • Zambia, Africa; June 3, 1999 (Path/Row 175/70)
Objectives of this Investigation • Evaluate and compare Landsat 5 and 7 data using a “typical” user’s viewpoint • Develop empirical relationships between Landsat 5 and 7 data to facilitate monitoring investigations • Mitigate user concerns regarding presumed difficulty when comparing data sets from Landsat 5 with Landsat 7 for applications
General Procedure for Comparing L5 and L7 Data • Extract mean DN values from 20 homogeneous targets from each of three pairs of L7 and L5 images • Develop L5-L7 regression equations for each band • Radiometrically normalize L7 DN’s to L5 DN’s, convert to radiance and compare with radiance estimates using L5 and L7 prelaunch coefficients • Other comparisons (statistical, NDVI, classification)
Comparisons Between Different TM Data Sets; R-Square Values (60 Targets)
Potential Causes of Differences between L5 and L7 Underfly Radiances • Differences in processing systems (NLAPS vs LPGS) • Differences in pre-launch calibration (more testing done with L7 than L5) • Differences in instrument temperatures • Degradations in L5 detector gain, detector bias, internal calibrator, optical components
Comparison Between L7 and L5 Niobrara Classification Results Orange=L5 Turquoise=L7
General Conclusions; Underfly Data • Variability within homogenous targets is lower for L7 (less noise ) than L5 TM except for Band 3 • Radiometric rectification of L5 to L7 data yields very similar products (images, NDVI, classification products) • Conversion of L7 and L5 datasets to radiance using prelaunch coefficients yields differences of up to 20%
EDC Field Site Purpose: To develop better quantitative and qualitative understanding of Landsat ETM+ spectral data for representative land cover types
EDC Field Site Components 1) Multitemporal Landsat TM/ETM+ Data Acquisition (Path/Row 29/29; 29/30) 2) Acquisition of Sun Photometry Data 3) Atmospheric Correction of Data 4) Acquisition of Qualitative Field Data 5) Acquisition of Field Spectral Data 6) Acquisition of Biophysical Data (fPAR, LAI) 7) Integration of above data sets
EDC Field Site; Qualitative Observations • Enlisted 60+ “volunteers” at EDC • Each volunteer tracks 1-5 sites on a weekly basis • Observations include land cover type, onset of greenness, % brown vegetation/soil, onset of senescence, height of vegetation, time of harvest, time of flowering, etc.)
What do we expect to learn from this project? • Better understanding of relationship among phenological change and reflectance for many cover types • Better understanding of the impacts of atmospheric corrections on ETM+ imagery • Better understanding of benefits/limitations of “volunteer” involvement