Download
1 / 10
100 likes | 202 Vues
Statement of Cash Flows. Cash Flows by area Most numbers derived from changes in Balance Sheet Accounts Focuses on Sources and Uses of Funds Period of Time Relatively Recent Statement, late 1980’s. Organization of Cash Flow Statement. Operating Activities:

E N D
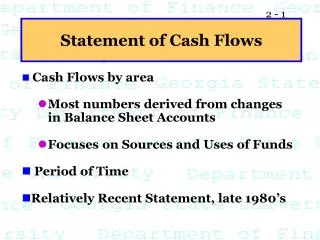
Statement of Cash Flows • Cash Flows by area • Most numbers derived from changes in Balance Sheet Accounts • Focuses on Sources and Uses of Funds • Period of Time • Relatively Recent Statement, late 1980’s
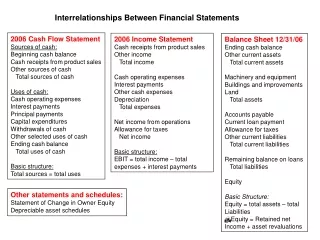
Organization of Cash Flow Statement • Operating Activities: • Best Indicator of Business Health • Current Accounts • Net Income • Depreciation • Day to day, core business activities • Investing Activities • Long Term, Strategic Activities • Fixed Assets (Gross PP&E) • M&A Activity
Organization of Cash Flow Statement • Financing Activities • Acquisition of funds from or payment of funds to claimants (owners or creditors) • Notes Payable and Lower RHS • Dividend Paid or Received • Financing Activities • General Key: Increases in Assets are uses of funds/outflows • “remember one and get three for free”
Balance Sheets: Assets 1998 1997 Cash 7,282 9,000 Short-term inv. 0 48,600 AR 632,160 351,200 Inventories 1,287,360715,200 Total CA 1,926,802 1,124,000 Gross FA 1,202,950 491,000 Less: Depr. 263,160146,200 Net FA 939,790344,800 Total assets 2,866,592 1,468,800
Liabilities and Equity 1998 1997 Accts payable 524,160 145,600 Notes payable 720,000 200,000 Accruals 489,600 136,000 Total CL 1,733,760 481,600 Long-term debt 1,000,000 323,432 Common stock 460,000 460,000 Retained earnings (327,168) 203,768 Total equity 132,832 663,768 Total L&E 2,866,592 1,468,800
Statement of Cash Flows: 1998 OPERATING ACTIVITIES Net Income (519,936) Adjustments: Depreciation 116,960 Change in AR (280,960) Change in inventories (572,160) Change in AP 378,560 Change in accruals 353,600 Net cash provided by ops. (523,936)
L-T INVESTING ACTIVITIES Investments in fixed assets (711,950) FINANCING ACTIVITIES Change in s-t investments 48,600 Change in notes payable 520,000 Change in long-term debt 676,568 Payment of cash dividends (11,000) Net cash from financing 1,234,168 Sum: net change in cash (1,718) Plus: cash at beginning of year 9,000 Cash at end of year 7,282
Analysis of Statement of Cash Flows • What were the major sources and uses of cash? • What % of inflows and outflows came from the three areas? • What lifecycle stage is the firm in? • Is cash being created internally or externally? • Is the pattern typical (and sustainable), or not?
What can you conclude about the company’s financial condition from its statement of cash flows? • Net cash from operations = -$523,936, mainly because of negative net income. • The firm borrowed $1,185,568 and sold $48,600 in short-term investments to meet its cash requirements. • Even after borrowing, the cash account fell by $1,718.
Got questions?Get answers!! • Voicemail: • Email: (404) 651-2691 chodges@gsu.edu • Electronic Bulletin Board: http://www.voy.com/4032