Download

1 / 37
370 likes | 530 Vues
The Housing Market. Chapter 13. Efficient markets. Large number of buyers and sellers Homogeneous goods Perfect information about quality Housing market has none of these, but it is still 90% efficient

E N D
The Housing Market Chapter 13 1
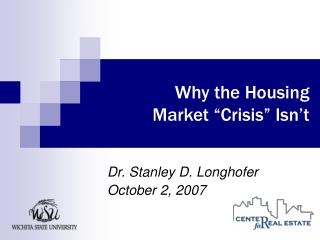
Efficient markets • Large number of buyers and sellers • Homogeneous goods • Perfect information about quality • Housing market has none of these, but it is still 90% efficient • Different personalities, search strategies and negotiating abilities of agents cause a thick supply and demand curve with a bell-shaped distribution of prices at each quantity. 2
Thick supply and demand curves for housing $110,000 $100,000 $90,000 3
Housing market • Stock of housing • Quantity: • Count of homes/apartments of specific quality • Price • Average price of median home • Purchase price • Monthly rent 4
Housing market • Flow of housing services • Quantity: • Housing units • Price determined using : • Repeat sales price index • Hedonic regression techniques 5
Repeat sales price index • Index of average sales prices of homes sold more than once within a given timeframe. • Eliminates renovated houses • Eliminates houses only sold once 6
Repeat sales price index • Benefits: • May be the only viable way to estimate house price inflation for a community • Problems: • Excluded properties mean loss of valuable information • Does not account for neighborhood changes • “Lemon effect” may bias index downward 7
Amenities and Housing Values • Three types of amenities • Natural amenities • Green spaces, proximity to water, proximity to scenic landscapes • Historic districts • Endogenous amenities • Quality education, proximity to entertainment spots, nice restaurants, • Disamenities (location near pollution, unaesthetic structures, noise source) decrease land values. 8
Housing Supply Functions • Risky investment • Durable good • Never identical to another if only because of location • Impossible to move neighborhood amenities 9
Suppliers of housing • Sources: • New home builders and rental agencies • Current homeowners • Government agencies • Each reacts to different incentives (maximize profits or maximize utility) 10
Housing Demand • Sources: • In-migrants • New householders • Life-cycle hypothesis • Aged 15-25 no longer want to live with parents • Middle-aged need house large enough for family. Demand changes with marriage and divorce rates. • Elderly need easy-access home near caregivers, hospitals. 11
Tenure Choice: Rent or own? • Renters • Young householders • Elderly (sell homes to become financially liquid) • Poor • Single parents • Those who don’t plan to stay long 12
Residential Succession • How occupancy of one housing unit passes from one income or demographic group to another • Filtering model (a.k.a. Natural Evolution Theory of Urban Expansion) • Externality theory 13
Filtering theory • Housing is a normal good. • As incomes increase, people want to consumer more units of housing services, so they move. • Over time, housing units filter down to successively lower income groups as area incomes increase. • Provision of affordable housing unnecessary—market provides it through filtering 14
Externality theory • Fiscal and social environment of city centers, income levels of neighbors and racial composition explain housing turnover. • Neighborhood experiences influx of lower income, racially diverse households. • Original residents perceive lower neighborhood quality and want to move before their housing values decline. • Eventually neighborhood will “tip” from high-income to low-income area. • Construction of low-income housing beneficial method to prevent “white flight” 16
Segregation • U.S. was more segregated in 2001 than in 1860, before the Civil War. • Four hypotheses • Interracial income differences mixed with the filtering hypothesis to separate races • Voluntary sorting • Racial steering • Housing and zoning regulations • Dissimilarity index measures extend of racial segregation 17
Dissimilarity (segregation) index • Piw is the number of whites living in the ith census tract of the city • Pw is the total number of whites in the city • Pih is the number of the specific racial/ethnic minority population h living in the ith census tract of the city. • Ph is the total number of that specific population in the city • n is the number of census tracts in the city. 18
Spatial Mismatch • Structural unemployment • Inadequate information about jobs • High costs of commuting • Long-term unemployed in inner city not taking suburban jobs • Job access hypothesis (Kain 1968, 1971) • Inner city concentrations of minorities limit access to suburban job opportunities and thus prolong structural unemployment. 20
Voluntary Sorting • Assumes that people want to live with their ethnic group to preserve language and culture • Especially true of new immigrants who do not speak the native language 21
Racial (Geographic Steering) • Perceived preference hypothesis: Real estate agents show whites and minorities houses in different neighborhoods because they • Assume their clients want to live with others of the same race-ethnicity • Want to maximize sales (and their own commissions) • Steer clients to specific neighborhoods • HUD’s Fair Housing Audits 1989, 2000 22
Local regulations • Regulations stipulating minimum lot sizes exclude low- and moderate-income households. • Topic continued in Ch. 15. 23
Affordability • Is it an income or housing problem? • Definition evolution • 1940: focus on overcrowding, dilapidation, private bathrooms and kitchens • 2000: focus is proportion of household income spent on housing • Median price /median income ratio • Glaeser and Gyourko (2003) concluded home prices close to physical cost of construction to keep up with housing codes. 24
Government and Housing • Government has moral dictate to intervene in market, or • Governmental policies cause lack of affordable housing • Three possible solutions • Public housing • Rent controls • Housing vouchers 25
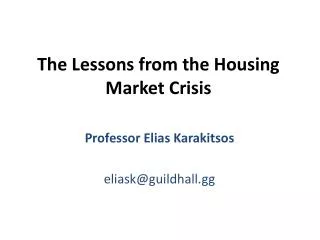
Public housing • “Projects” were a fiasco • Supposed to be temporary • Government crowded out market • Concentrated a large number of low-income people on an isolated site, • Residents had limited access to information about jobs • Example: Pruitt Igoe: Cost $15 billion in 1956 ($110 billion in $2006) demolished 16 years later 26
The destruction of the Pruitt-Igoe housing complex in 1972 29
Rent Controls • Popular since the days of Hammurabi (1792 BC) • Currently exist throughout the world 30
Rent Controls • First generation: hard rent controls • Analysis as standard price ceiling • Discourage investment • Arbitrary redistribution and black market • Rental stock deteriorates • Administrative nightmare • Rents declined in controlled area, but increased in uncontrolled residential areas 31
Rent Controls • Second generation: soft rent controls • Restrict annual increases in rents • Maintenance costs passed on to tenants • Do not necessarily decrease quantity or quality of housing supplied • May decrease mobility if landlords can increase rents for new tenants. • Mismatched housing 32
Housing Vouchers • Assumes that affordable housing is income problem, not housing problem • Households decide where to rent as long as unit meets the standards set by HUD. • Eliminates inefficiencies of government provision of housing • Eliminates bureaucracy of rent control 34
Why not just give cash? • Recipients can use the cash to maximize their utility. • Taxpayers are no worse off, recipients are better off. • Cash rather than housing voucher would thus be a Pareto Improvement • A Pareto improvement exists when someone can be made better off without harming another. 36
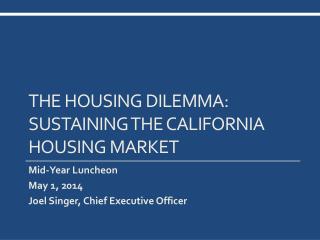
Housing vouchers vs cash when housing is an inferior good 37