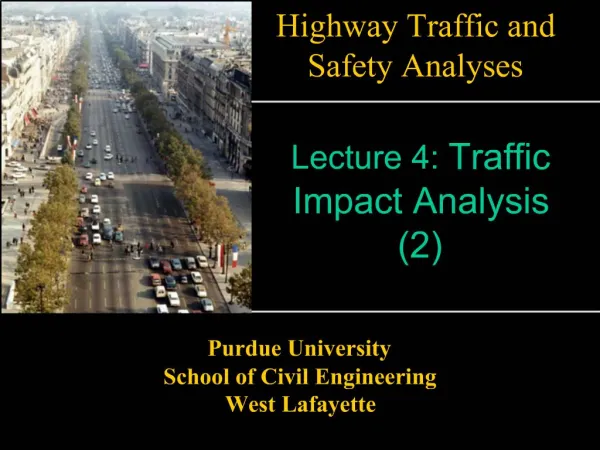
Traffic Impact Study
Traffic Impact Study. “Study to evaluate the impact on a roadway network due to a proposed development”. Proposed Multi-use Development. 100,000 sq.ft Retail Center 20,000 sq..ft Office Space 50 Apartment units. Basic Steps Involved:. Analysis of existing conditions

Traffic Impact Study
E N D
Presentation Transcript
Traffic Impact Study “Study to evaluate the impact on a roadway network due to a proposed development”
Proposed Multi-use Development • 100,000 sq.ft Retail Center • 20,000 sq..ft Office Space • 50 Apartment units
Basic Steps Involved: • Analysis of existing conditions • Trip Generation and Distribution • Analysis of future conditions
Analysis of Existing Conditions “Analysis to assess whether the intersections and roadways within the study area are currently operating at acceptable levels of service” • Traffic Data Collection • LOS Analysis for Intersections • Roadway Capacity Analysis • Queuing Analysis • Accident Analysis Steps Involved:
Trip Generation “Estimation of trips generated by the proposed development using the latest edition of Trip Generation published by ITE or actual traffic generation counts from a similar existing facility having the same size and surrounding area characteristics or from other recognized sources that provide trip generation data not included in the ITE manual”
Trip Generation Types of Trips • Total Trips • Shared (Captured) Trips • Pass-by Trips • Diverted (Linked) Trips • New (Destination) Trips
Total Trips Total number of trips generated by a land use category = ITE Trip Rate X Area or Employees or Dwelling Units etc. Example: Shopping Center: Land Use 820 100,000 sq. ft. Use Average Rate for Adjacent Street Peak T = 3.75 (X) T =3.75 (100) = 375 trips 180 enter / 195 exit (48%/52%) Office: Land Use 710 20,000 sq. ft. Use Average Rate for Adjacent Street Peak T = 1.49 (X) T =1.49 (20) = 30 trips 5 enter / 25 exit (17%/83%) Apartment: Land Use 220 50 units Use Average Rate for Adjacent Street Peak T = 0.62 (50) T =0.62 (50) = 31 trips 20 enter / 11 exit (65%/35%)
Shared (Internal)Trips “These are trips which occur on the site where a vehicle will stop at more than one place on the site. For example, someone destined for the office on the site may stop at the Shopping Center while hey are on the site” Shared Trips = Shared Trips Rate X Total Trips Example: Shopping Center 5% x Total Generated = 0.05 x 375 = 18 10 enter / 8 exit Office 20% x Total Generated = 0.20 x 30 = 6 2 enter / 4 exit Apartment 39% x Total Generated = 0.39 x 31 = 12 6 enter / 6 exit INTERNAL TRIPS = 36 18 enter /18 exit
Pass-By Trips These trips represent vehicles which currently use adjacent roadways providing primary access to the new land use / project. These trips, however, have an ultimate destination other than the project in question. In this example, the trip started from work with a destination of home, however on the way, the driver stopped at the shopping center directly adjacent to their path Pass-by Trips = ITE Average Pass-by Rate X (Total Generated – Shared) Sopping Center: 39.5% (375-18) = 141 71 enter / 70 exit Apartment: 0% (31-12) = 0 0 enter / 0 exit Office: 0% (30-6) = 0 0 enter / 0 exit TOTAL PASS-BY = 141 71 enter / 70 enter
Diverted Trips These trips occur when a vehicle takes a different route than normal to access a specific facility. Diverted trips are similar to pass-by trips, but diverted trips occur from roadways which do not provide direct access to the site. Instead, one or more streets must be utilized to get to and from the site Diverted Trips = Rate x (Total Generated – Shared) Sopping Center: 32% (375-18) = 114 57 enter / 57 exit Apartment: 0% (31-12) = 0 0 enter / 0 exit Office: 0% (30-6) = 0 0 enter / 0 exit TOTAL PASS-BY = 114 57 enter / 57 enter
New Trips These trips occur only to access a specific land use such as the discount superstore. These types of trips will travel to and from the new site and a single other destination such as home New Trips= External Trips-Internal Trips-Pass-by Trips- Diverted trips Shopping center: 375 – 18 – 141 –114 = 102 42 enter / 60 exit Office: 30 –6 –0 –0 = 24 3 enter / 21 exit Apartment: 31 –12 – 0 – 0 = 19 14 enter / 5 exit TOTAL NEW TRIPS = 145 59 enter / 86 exit
Trip Distribution “Distribution of site traffic shall be assigned to the proposed site driveways and street intersections included within the study area based on an analysis of the market area, the area surrounding the site from which the project is likely to draw a high percentage of its trips established based upon a travel distance derived from travel time and travel speed, for the proposed development” Existing traffic counts, a regional transportation model or local knowledge can be used to develop traffic distribution.
Analysis of Future Conditions “Analysis to assess whether the intersections and roadways within the study area will operate within the acceptable levels of service for future conditions. Future conditions involve with and without project conditions” Without Project Traffic = Ambient traffic growth rate * Existing Traffic + Background project Traffic With Project Traffic = Without project traffic + Project traffic
Future Analysis i) LOS Analysis for Intersections ii) Road Capacity Analysis iii) Queuing Analysis iv) Signal Warrant Analysis Conclusions and Recommendations i) LOS Results ii) Capacity Analysis Results iii) Signal Warrant Analysis Results
Thank You! Sajeev