Understanding Variable Relationships and Measures of Central Tendency in Data Analysis
In this chapter, we explore the use of graphs, tables, and diagrams to illustrate variable relationships, emphasizing cumulative frequency, percentile rank, and cross-tabulations. We'll compute rates of change and understand their implications. We dive into measures of central tendency, defining mode, median, and mean, and when to use each. This chapter breaks down how to interpret data distributions, skewness, and kurtosis while providing examples for clarity. Learn how to select appropriate measures based on data type and research objectives.

Understanding Variable Relationships and Measures of Central Tendency in Data Analysis
E N D
Presentation Transcript
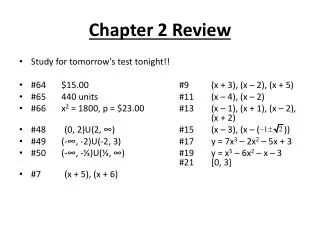
Chapter 2 Review • Using graphs/tables/diagrams to show variable relationships • Understand cumulative frequency, percentile rank, and cross-tabulations • Perform rates of change
Cumulative Frequencies / Percentile Rank What is the percentile rank for those with 5 arrests?
Cross-Tabulations Attitude towards Lowering the Drinking Age to 19
Rate of Change • Rate of Change = (100) * (time 2f – time 1f) (time1f) • Allows us to compare the same population at two points in time. • Always be aware of the sign. • A negative percent signifies a reduction • A positive percent signifies an increase
Measures of Central Tendency • Three main types • Mode • Median • Mean • Choice depends upon level of measurement
The Mode • The mode is the most frequently occurring value in a distribution. • Abbreviated as Mo • Sometimes there is more than one mode • EX: 96, 91, 96, 90, 93, 90, 96, 90 • Bimodal • Mode is the only measure of central tendency appropriate for nominal-level variables
Mode - Example • What is the mode for the following set of numbers? • 20, 21, 30, 20, 22, 20 • Explains nothing about • Ordering of variables • Variation within variables • Distributions can be bimodal and/or multimodal • Several categories with same frequencies
Position of the Mdn The Median • The median is the middle case of a distribution • Abbreviated as Mdn • Appropriate for ordinal data because it only shows direction and not distance • Used if distribution is skewed • How to find the median? • If even, there will be two middle cases – interpolate • If odd, choose the middle-most case • Cases must be ordered
What is the median? odd or even? (7+1)/2=4th case Where is the 4th case? Sort distribution from lowest to highest 1 5 2 9 13 11 4 Example of median: Years in Prison
(8+1)/2=4.5 Half way between the 4th and 5th case (2 + 3) / 2 = 2.5 Median = 2.5 1 1 2 2 3 4 4 6 Example of median with even # of cases Position of the Mdn
The Mean • Most popular measure of central tendency • Assumes equality of intervals • Basis of many higher order formulas for statistical procedures • Use either μ or X depending on whether population or sample estimate
The Mean • The mean is appropriate for interval and ratio level variables X = raw scores in a set of scores N = total number of scores in a set
What is the mean? 4.6 7.9 11.4 2.2 Example: Prison Sentences
The Mean • What does the mean do? • Center of gravity • Deviation = (Raw Score – Mean) Mean = 6 = (∑X / N) = (30 / 5)
The Weighted Mean • The “mean of the means” • overall mean for a number of groups • Best used for unequal groups Example: 4, 7, 3, 8 2, 4, 9, 1, 6, 8
An Illustration: Measures of Central Tendency in a Skewed Distribution • Mean = $50,000 • Median = $40,000 • Mode = $30,000
Comparing the Mode, Median, and Mean • Three factors in choosing a measure of central tendency • Level of measurement • Shape or form of the distribution of data • Skewness • Kurtosis • Research Objective
Shape of the Distribution • In symmetrical distribution – mode, median, and mean have identical values • In skewed data, the measures of central tendency are different • Skewness relevant only at the interval level • Mean heavily influenced by extreme outliers • median best measure in this situation
Research Objective • Choice of reported central tendency depends on the level of precision required. • Most published research requires median and/or mean calculations. • In skewed data, median more balanced view • For advanced statistical analyses, mean usually preferred • In large data sets, mean most stable measure
Summary • Three best known measure of central tendency – mode, median, mode • Three factors determine appropriateness • Level of measurement • Shape of the distribution • Research objective