Coated Fabrics Market
170 likes | 209 Vues
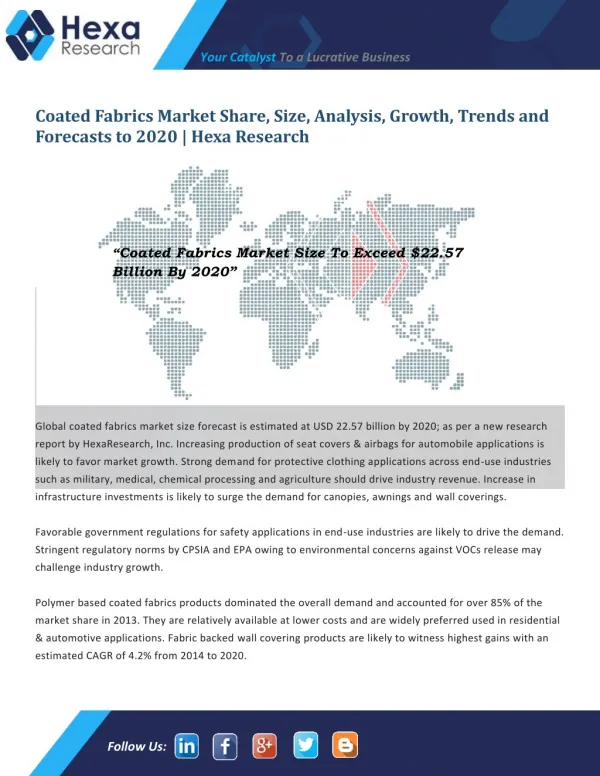
Coated Fabrics Market Size To Exceed $22.57 Billion By 2020

Coated Fabrics Market
E N D
Presentation Transcript
Your Catalyst To a Lucrative Business Coated Fabrics Market Share, Size, Analysis, Growth, Trends and Forecasts to 2020 | Hexa Research “Coated Fabrics Market Size To Exceed $22.57 Billion By 2020” Global coated fabrics market size forecast is estimated at USD 22.57 billion by 2020; as per a new research report by HexaResearch, Inc. Increasing production of seat covers & airbags for automobile applications is likely to favor market growth. Strong demand for protective clothing applications across end-use industries such as military, medical, chemical processing and agriculture should drive industry revenue. Increase in infrastructure investments is likely to surge the demand for canopies, awnings and wall coverings. Favorable government regulations for safety applications in end-use industries are likely to drive the demand. Stringent regulatory norms by CPSIA and EPA owing to environmental concerns against VOCs release may challenge industry growth. Polymer based coated fabrics products dominated the overall demand and accounted for over 85% of the market share in 2013. They are relatively available at lower costs and are widely preferred used in residential & automotive applications. Fabric backed wall covering products are likely to witness highest gains with an estimated CAGR of 4.2% from 2014 to 2020. Follow Us:
Your Catalyst To a Lucrative Business The report “Coated Fabrics Market Size, Share, Forecast Report, 2020” is available now to HexaResearch customers and can also be purchased directly at Browse Details of Report @ http://www.hexaresearch.com/research-report/coated-fabrics-industry Key report insights suggest: Global coated fabrics market was estimated 3,400.2 million square meters in 2013 and may register 4,400.0 million square meters by 2020 growing with an estimated CAGR of 3.8% from 2014 to 2020. Transportation application witnessed the highest demand and accounted for 34.8% of market share in 2013. Government initiative for safety norms for automobile applications coupled with increasing infrastructure developments for metros and railways are expected to drive demand for transportation applications. Furniture applications are anticipated to witness highest gains at an estimated CAGR of 5.6% from 2014 to 2020. Asia Pacific dominated the regional demand and accounted for 50% of the total share in 2013 and is expected witness highest growth rate over the forecast period. Rapid industrialization coupled with increase in automobile production particularly in China, India, Indonesia and Thailand is likely to surge coated fabrics demand. Europe coated fabrics market is likely to grow moderately at 3.2% from 2014 to 2020. Polymer coated fabrics in Europe accounted for a major share of 87.0% in 2013 and are expected to witness steady gains over the forecast period. Coated fabrics industry is not too consolidated with top six industry participants constituting around 26% of the market share. Key companies involved in this market are Omnova, Takata Corporation, Saint Gobain, Trelleborg AB, Spradling International, Bo-Tex Sales, ContiTech AG and Mauritzon Inc. For the purpose of this study, HexaResearch has segmented the coated fabrics market on the basis of product, application and region: Global Coated Fabrics Product Overview (Volume, Million Square Meters; Revenue, USD Million, 2012 – 2020) Polymer coated fabrics Rubber coated fabrics Fabrics backed wall coverings Global Coated Fabrics Application Overview (Volume, Million Square Meters; Revenue, USD Million, 2012 – 2020) Transportation Protective clothing Industrial Furniture Others Global Coated Fabrics Product Overview (Volume, Million Square Meters; Revenue, USD Million, 2012 – 2020) Follow Us:
Your Catalyst To a Lucrative Business North America Europe Asia Pacific RoW Browse Related Category Market Reports @ https://www.hexaresearch.com/research-category/specialty- ceramic-glass-and-fiber-industry Table of Contents Chapter 1 Executive Summary 1.1 Coated Fabrics - Industry Summary & Critical Success Factors (CSFs) Chapter 2 Coated Fabrics Industry Outlook 2.1 Market Segmentation 2.2 Market Size and Growth Prospects 2.3 Coated Fabrics Value Chain Analysis 2.4 Coated Fabrics Market Dynamics 2.4.1 Market driver analysis 2.4.1.1 Growing automotive market 2.4.1.2 Growing demand for protective clothing 2.4.1.3 Growing construction industry 2.4.2 Market restraint analysis 2.4.2.1 Environmental concerns 2.4.2.2 Availability of substitute products 2.5 Key Opportunities Prioritized 2.6 Industry Analysis - Porter's 2.7 Coated Fabrics - Company Market Share Analysis 2.8 Coated Fabrics - PESTEL Analysis Chapter 3 Coated Fabrics Product Outlook 3.1 Polymer Coated Fabrics 3.1.1. Global polymer coated fabrics demand, 2012 - 2020, (million square meters), (USD million) 3.2 Rubber Coated Fabrics 3.2.1. Global rubber coated fabrics demand, 2012 - 2020, (million square meters), (USD million) 3.3 Fabric backed wall coverings 3.3.1. Global fabric backed wall coverings demand, 2012 - 2020, (million square meters), (USD million) Chapter 4 Coated Fabrics Application Outlook 4.1 Transportation 4.1.1. Global demand from transportation, 2012 - 2020, (million square meters), (USD million) 4.2 Protective clothing 4.2.1. Global demand from protective clothing, 2012 - 2020, (million square meters), (USD million) Follow Us:
Your Catalyst To a Lucrative Business 4.3 Industrial 4.3.1. Global demand from industrial, 2012 - 2020, (million square meters), (USD million) 4.4 Furniture 4.4.1. Global demand from furniture, 2012 - 2020, (million square meters), (USD million) 4.5 Others 4.5.1. Global demand from other applications, 2012 - 2020, (million square meters), (USD million) Chapter 5 Coated Fabrics Regional Outlook 5.1 North America 5.1.1. Market volume & revenue by Product, 2012 - 2020 (million square meters), (USD million) 5.1.2. Market volume & revenue by Application, 2012 - 2020 (million square meters), (USD million) 5.2 Europe 5.2.1. Market volume & revenue by Product, 2012 - 2020 (million square meters), (USD million) 5.2.2. Market volume & revenue by Application, 2012 - 2020 (million square meters), (USD million) 5.3 Asia Pacific 5.3.1. Market volume & revenue by Product, 2012 - 2020 (million square meters), (USD million) 5.3.2. Market volume & revenue by application, 2012 - 2020 (million square meters), (USD million) 5.4 RoW 5.4.1. Market volume & revenue by Product, 2012 - 2020 (million square meters), (USD million) 5.4.2. Market volume & revenue by Application, 2012 - 2020 (million square meters), (USD million) Chapter 6 Coated Fabrics Competitive Landscape 6.1 Omnova Solutions 6.1.1. Company Overview 6.1.2. Financial Performance 6.1.3. Product Benchmarking 6.1.4. Strategic Initiatives 6.2 Spradling international 6.2.1. Company Overview 6.2.2. Financial Performance 6.2.3. Product Benchmarking 6.2.4. Strategic Initiatives 6.3 Saint Gobain 6.3.1. Company Overview 6.3.2. Financial Performance 6.3.3. Product Benchmarking 6.3.4. Strategic Initiatives 6.4 Takata Corporation 6.4.1. Company Overview 6.4.2. Financial Performance 6.4.3. Product Benchmarking 6.4.4. Strategic Initiatives 6.5 Trelleborg AB 6.5.1. Company Overview 6.5.2. Financial Performance 6.5.3. Product Benchmarking Follow Us:
Your Catalyst To a Lucrative Business 6.5.4. Strategic Initiatives 6.6 Bo-Tex Sales Cor 6.6.1. Company Overview 6.6.2. Financial Performance 6.6.3. Product Benchmarking 6.6.4. Strategic Initiatives 6.7 Mauritzon, Inc 6.7.1. Company Overview 6.7.2. Financial Performance 6.7.3. Product Benchmarking 6.7.4. Strategic Initiatives 6.8 Conti Tech AG 6.8.1. Company Overview 6.8.2. Financial Performance 6.8.3. Product Benchmarking 6.8.4. Strategic Initiatives 6.9 Isotex 6.9.1. Company Overview 6.9.2. Financial Performance 6.9.3. Product Benchmarking 6.9.4. Strategic Initiatives 6.10. Graniteville Specialty Fabrics 6.10.1. Company Overview 6.10.2. Financial Performance 6.10.3. Product Benchmarking 6.10.4. Strategic Initiatives Chapter 7 Methodology & Scope 7.1 Research Methodology 7.2 Research Scope & Assumptions 7.3 List of Data Sources About Us: Hexa Research is a market research and consulting organization, offering industry reports, custom research and consulting services to a host of key industries across the globe. We offer comprehensive business Follow Us:
Your Catalyst To a Lucrative Business intelligence in the form of industry reports which help our clients obtain clarity about their business environment and enable them to undertake strategic growth initiatives. Contact Us: Ryan Shaw Hexa Research Felton Office Plaza 6265 Highway 9 Felton, California 95018 United States Phone: +1-800-489-3075 Email: sales@hexaresearch.com Read Our Latest Blogs: hexaresearch1.blogspot.com Table of Content Of Geotextiles Market: Table of Contents: Chapter 1 Methodology and Scope 1.1 Research methodology 1.2 Research scope and assumptions 1.3 List of data sources Chapter 2 Executive Summary 2.1 Ammonium Sulfate - Industry Summary & Key Buying Criteria, 2012 - 2022 Chapter 3 Ammonium Sulfate Industry Outlook 3.1 Ammonium sulfate market segmentation 3.2 Market size and growth prospects, 2012 - 2022 3.3 Ammonium sulfate value chain analysis 3.3.1 Vendor landscape 3.4 End-user landscape 3.4.1 Profiles of liquid ammonium sulfate key end-use companies 3.4.1.1 Domo Chemicals 3.4.1.1.1 Company Overview Follow Us:
Your Catalyst To a Lucrative Business 3.4.1.1.2 Contact Details 3.4.1.1.3 Financial Performance 3.4.1.1.4 Product Benchmarking 3.4.1.1.5 Standard Specifications 3.4.1.2 Plant Food Chemical Co., Inc. 3.4.1.2.1 Company Overview 3.4.1.2.2 Contact Details 3.4.1.2.3 Financial Performance 3.4.1.2.4 Product Benchmarking 3.4.1.2.5 Standard Specifications 3.4.1.3 Tampa Bay Water 3.4.1.3.1 Company Overview 3.4.1.3.2 Contact Details 3.4.1.3.3 Financial Performance 3.4.1.3.4 Product Benchmarking 3.4.1.3.5 Strategic Initiatives 3.4.1.3.6 Standard Specifications 3.4.2 Profiles of solid ammonium sulfate key end-use companies 3.4.2.1 Domo Chemicals 3.4.2.1.1 Company Overview 3.4.2.1.2 Contact Details 3.4.2.1.3 Financial Performance 3.4.2.1.4 Product Benchmarking 3.4.2.1.5 Standard Specifications 3.4.2.2 Honeywell 3.4.2.2.1 Company Overview 3.4.2.2.2 Contact Details 3.4.2.2.3 Financial Performance 3.4.2.2.4 Product Benchmarking 3.4.2.2.5 Strategic Initiatives 3.4.2.2.6 Standard Specifications 3.4.2.3 Helm AG 3.4.2.3.1 Company Overview 3.4.2.3.2 Contact Details 3.4.2.3.3 Financial Performance 3.4.2.3.4 Product Benchmarking Follow Us:
Your Catalyst To a Lucrative Business 3.4.2.3.5 Strategic Initiatives 3.4.2.3.6 Standard Specifications 3.4.2.4 OCI Nitrogen B.V. 3.4.2.4.1 Company Overview 3.4.2.4.2 Contact Details 3.4.2.4.3 Financial Performance 3.4.2.4.4 Product Benchmarking 3.4.2.4.5 Standard Specifications 3.4.2.5 Trammo, Inc. 3.4.2.5.1 Company Overview 3.4.2.5.2 Contact Details 3.4.2.5.3 Financial Performance 3.4.2.5.4 Product Benchmarking 3.4.2.5.5 Strategic Initiatives 3.4.3 Geographic presence 3.4.4 Key buying criteria 3.5 Technological landscape 3.6 Regulatory framework 3.7 Production capacity by company, 2013 3.8 Production capacity by counties, 2010 3.9 Production processes 3.9.1 Synthetic 3.9.2 Caprolactum 3.9.3 Coke oven process 3.9.4 Emissions 3.9.5 Gypsum 3.9.6 Cyanuric acid 3.9.7 Others 3.10 Ammonium sulfate market dynamics 3.10.1 Market driver analysis 3.10.1.1 Growing demand for fertilizers 3.10.1.2 Growth of food additive application in confectioneries and baked food industry 3.10.2 Market restraint analysis 3.10.2.1 Adverse health effects 3.11 Key opportunities prioritized 3.12 Industry analysis - Porter’s Follow Us:
Your Catalyst To a Lucrative Business 3.13 Ammonium sulfate company market share analysis, 2014 3.14 Ammonium Sulfate - PESTEL analysis Chapter 4 Ammonium Sulfate Product Outlook 4.1 Global ammonium sulfate market volume share by product, 2014 & 2022 4.2 Liquid ammonium sulfate 4.2.1 Market estimates and forecast, 2012 - 2022 4.2.2 Market estimates and forecast by region, 2012 - 2022 4.2.2.1 North America liquid ammonium sulfate market estimates and forecast by country, 2012 - 2022 4.2.2.2 Europe liquid ammonium sulfate market estimates and forecast by country, 2012 - 2022 4.2.2.3 Asia Pacific liquid ammonium sulfate market estimates and forecast by country, 2012 - 2022 4.2.2.4 MEA liquid ammonium sulfate market estimates and forecast by country, 2012 - 2022 4.2.2.5 CSA liquid ammonium sulfate market estimates and forecast by country, 2012 - 2022 4.3 Solid ammonium sulfate 4.3.1 Global solid ammonium sulfate market estimates and forecast, 2012 - 2022 4.3.2 Global solid ammonium sulfate market estimates and forecast by region, 2012 - 2022 4.3.2.1 North America solid ammonium sulfate market estimates and forecast by country, 2012 - 2022 4.3.2.2 Europe solid ammonium sulfate market estimates and forecast by country, 2012 - 2022 4.3.2.3 Asia Pacific solid ammonium sulfate market estimates and forecast by country, 2012 - 2022 4.3.2.4 MEA solid ammonium sulfate market estimates and forecast by country, 2012 - 2022 4.3.2.5 CSA solid ammonium sulfate market estimates and forecast by country, 2012 - 2022 Chapter 5 Ammonium Sulfate Application Outlook 5.1 Global ammonium sulfate market volume share by application, 2014 & 2022 5.2 Fertilizers 5.2.1 Global ammonium sulfate market estimates and forecast in fertilizers, 2012 - 2022 5.2.2 Global ammonium sulfate market estimates and forecast in fertilizers by region, 2012 - 2022 5.2.2.1 North America ammonium sulfate market estimates and forecast in fertilizers by country, 2012 - 2022 5.2.2.2 Europe ammonium sulfate market estimates and forecast in fertilizers by country, 2012 - 2022 5.2.2.3 Asia Pacific ammonium sulfate market estimates and forecast in fertilizers by country, 2012 - 2022 5.2.2.4 MEA ammonium sulfate market estimates and forecast in fertilizers by country, 2012 - 2022 5.2.2.5 CSA ammonium sulfate market estimates and forecast in fertilizers by country, 2012 - 2022 5.3 Industrial use 5.3.1 Global ammonium sulfate market estimates and forecast in industrial use, 2012 - 2022 Follow Us:
Your Catalyst To a Lucrative Business 5.3.2 Global ammonium sulfate market estimates and forecast in industrial use by region, 2012 - 2022 5.3.2.1 North America ammonium sulfate market estimates and forecast in industrial use by country, 2012 - 2022 5.3.2.2 Europe ammonium sulfate market estimates and forecast in industrial use by country, 2012 - 2022 5.3.2.3 Asia Pacific ammonium sulfate market estimates and forecast in industrial use by country, 2012 - 2022 5.3.2.4 MEA ammonium sulfate market estimates and forecast in industrial use by country, 2012 - 2022 5.3.2.5 CSA ammonium sulfate market estimates and forecast in industrial use by country, 2012 - 2022 5.4 Food additives 5.4.1 Global ammonium sulfate market estimates and forecast in food additives, 2012 - 2022 5.4.2 Global ammonium sulfate market estimates and forecast in food additives by region, 2012 - 2022 5.4.2.1 North America ammonium sulfate market estimates and forecast in food additives by country, 2012 - 2022 5.4.2.2 Europe ammonium sulfate market estimates and forecast in food additives by country, 2012 - 2022 5.4.2.3 Asia Pacific ammonium sulfate market estimates and forecast in food additives by country, 2012 - 2022 5.4.2.4 MEA ammonium sulfate market estimates and forecast in food additives by country, 2012 - 2022 5.4.2.5 CSA ammonium sulfate market estimates and forecast in food additives by country, 2012 - 2022 5.5 Others 5.5.1 Global ammonium sulfate market estimates and forecast in other applications, 2012 - 2022 5.5.2 Global ammonium sulfate market estimates and forecast in other applications by region, 2012 - 2022 5.5.2.1 North America ammonium sulfate market estimates and forecast in other applications by country, 2012 - 2022 5.5.2.2 Europe ammonium sulfate market estimates and forecast in other applications by country, 2012 - 2022 5.5.2.3 Asia Pacific ammonium sulfate market estimates and forecast in other applications by country, 2012 - 2022 5.5.2.4 MEA ammonium sulfate market estimates and forecast in other applications by country, 2012 - 2022 Follow Us:
Your Catalyst To a Lucrative Business 5.5.2.5 CSA ammonium sulfate market estimates and forecast in other applications by country, 2012 - 2022 Chapter 6 Ammonium Sulfate Regional Outlook 6.1 Global ammonium sulfate market volume share by region, 2014 & 2022 6.2 North America 6.2.1 Market estimates and forecast, 2012 - 2022 6.2.2 Market estimates and forecast by product, 2012 - 2022 6.2.3 Market estimates and forecast by application, 2012 - 2022 6.2.4 U.S. 6.2.4.1 Market estimates and forecast, 2012 - 2022 6.2.4.2 Market estimates and forecast by product, 2012 - 2022 6.2.4.3 Market estimates and forecast by application, 2012 - 2022 6.2.5 Canada 6.2.5.1 Market estimates and forecast, 2012 - 2022 6.2.5.2 Market estimates and forecast by product, 2012 - 2022 6.2.5.3 Market estimates and forecast by application, 2012 - 2022 6.3 Europe 6.3.1 Market estimates and forecast, 2012 - 2022 6.3.2 Market estimates and forecast by product, 2012 - 2022 6.3.3 Market estimates and forecast by application, 2012 - 2022 6.3.4 Germany 6.3.4.1 Market estimates and forecast, 2012 - 2022 6.3.4.2 Market estimates and forecast by product, 2012 - 2022 6.3.4.3 Market estimates and forecast by application, 2012 - 2022 6.3.5 UK 6.3.5.1 Market estimates and forecast, 2012 - 2022 6.3.5.2 Market estimates and forecast by product, 2012 - 2022 6.3.5.3 Market estimates and forecast by application, 2012 - 2022 6.3.6 France 6.3.6.1 Market estimates and forecast, 2012 - 2022 6.3.6.2 Market estimates and forecast by product, 2012 - 2022 6.3.6.3 Market estimates and forecast by application, 2012 - 2022 6.3.7 Spain 6.3.7.1 Market estimates and forecast, 2012 - 2022 6.3.7.2 Market estimates and forecast by product, 2012 - 2022 Follow Us:
Your Catalyst To a Lucrative Business 6.3.7.3 Market estimates and forecast by application, 2012 - 2022 6.3.8 Italy 6.3.8.1 Market estimates and forecast, 2012 - 2022 6.3.8.2 Market estimates and forecast by product, 2012 - 2022 6.3.8.3 Market estimates and forecast by application, 2012 - 2022 6.4 Asia Pacific 6.4.1 Market estimates and forecast, 2012 - 2022 6.4.2 Market estimates and forecast by product, 2012 - 2022 6.4.3 Market estimates and forecast by application, 2012 - 2022 6.4.4 China 6.4.4.1 Market estimates and forecast, 2012 - 2022 6.4.4.2 Market estimates and forecast by product, 2012 - 2022 6.4.4.3 Market estimates and forecast by application, 2012 - 2022 6.4.5 India 6.4.5.1 Market estimates and forecast, 2012 - 2022 6.4.5.2 Market estimates and forecast by product, 2012 - 2022 6.4.5.3 Market estimates and forecast by application, 2012 - 2022 6.4.6 Japan 6.4.6.1 Market estimates and forecast, 2012 - 2022 6.4.6.2 Market estimates and forecast by product, 2012 - 2022 6.4.6.3 Market estimates and forecast by application, 2012 - 2022 6.4.7 South Korea 6.4.7.1 Market estimates and forecast, 2012 - 2022 6.4.7.2 Market estimates and forecast by product, 2012 - 2022 6.4.7.3 Market estimates and forecast by application, 2012 - 2022 6.5 Middle East and Africa 6.5.1 Market estimates and forecast, 2012 - 2022 6.5.2 Market estimates and forecast by product, 2012 - 2022 6.5.3 Market estimates and forecast by application, 2012 - 2022 6.5.4 Saudi Arabia 6.5.4.1 Market estimates and forecast, 2012 - 2022 6.5.4.2 Market estimates and forecast by product, 2012 - 2022 6.5.4.3 Market estimates and forecast by application, 2012 - 2022 6.6 Central and South America 6.6.1 Market estimates and forecast, 2012 - 2022 6.6.2 Market estimates and forecast by product, 2012 - 2022 Follow Us:
Your Catalyst To a Lucrative Business 6.6.3 Market estimates and forecast by application, 2012 - 2022 6.6.4 Brazil 6.6.4.1 Market estimates and forecast, 2012 - 2022 6.6.4.2 Market estimates and forecast by product, 2012 - 2022 6.6.4.3 Market estimates and forecast by application, 2012 - 2022 Chapter 7 Competitive Landscape 7.1 BASF Antwerpen 7.1.1 Company Overview 7.1.2 Contact Details 7.1.3 Financial Performance 7.1.4 Product Benchmarking 7.2 Evonik Antwerpen 7.2.1 Company Overview 7.2.2 Contact Details 7.2.3 Financial Performance 7.2.4 Product Benchmarking 7.3 Lanxess Antwerpen 7.3.1 Company Overview 7.3.2 Contact Details 7.3.3 Financial Performance 7.3.4 Product Benchmarking 7.4 Novus 7.4.1 Company Overview 7.4.2 Contact Detail 7.4.3 Financial Performance 7.4.4 Product Benchmarking 7.5 Sumitomo Chemical 7.5.1 Company Overview 7.5.2 Contact Details 7.5.3 Financial Performance 7.5.4 Product Benchmarking 7.6 Honeywell 7.6.1 Company Overview 7.6.2 Contact Details 7.6.3 Financial Performance Follow Us:
Your Catalyst To a Lucrative Business 7.6.4 Product Benchmarking 7.7 Royal DSM 7.7.1 Company Overview 7.7.2 Contact Details 7.7.3 Financial Performance 7.7.4 Product Benchmarking 7.7.5 Strategic Initiatives 7.8 Helm AG 7.8.1 Company Overview 7.8.2 Contact Details 7.8.3 Financial Performance 7.8.4 Product Benchmarking 7.8.5 Strategic Initiatives 7.9 ArcelorMittal 7.9.1 Company Overview 7.9.2 Contact Details 7.9.3 Financial Performance 7.9.4 Product Benchmarking 7.10 Tereos 7.10.1 Company Overview 7.10.2 Contact Details 7.10.3 Financial Performance 7.10.4 Product Benchmarking 7.11 Agrium 7.11.1 Company Overview 7.11.2 Contact Details 7.11.3 Financial Performance 7.11.4 Product Benchmarking 7.12 Domo Chemicals 7.12.1 Company Overview 7.12.2 Contact Details 7.12.3 Financial Performance 7.12.4 Product Benchmarking 7.12.5 Strategic Initiatives 7.13 Akzo Nobel N.V. 7.13.1 Company Overview Follow Us:
Your Catalyst To a Lucrative Business 7.13.2 Contact Details 7.13.3 Financial Performance 7.13.4 Product Benchmarking 7.14 SABIC 7.14.1 Company Overview 7.14.2 Contact Details 7.14.3 Financial Performance 7.14.4 Product Benchmarking 7.15 Arkema 7.15.1 Company Overview 7.15.2 Contact Details 7.15.3 Financial Performance 7.15.4 Product Benchmarking 7.16 Rentech 7.16.1 Company Overview 7.16.2 Contact Details 7.16.3 Financial Performance 7.16.4 Product Benchmarking 7.16.5 Strategic Initiatives Follow Us:
Your Catalyst To a Lucrative Business Follow Us:
Your Catalyst To a Lucrative Business Follow Us: