Download
1 / 19
200 likes | 353 Vues
Learn to write and evaluate exponential expressions to model growth and decay scenarios. Explore vocabulary and examples to enhance your understanding.

E N D
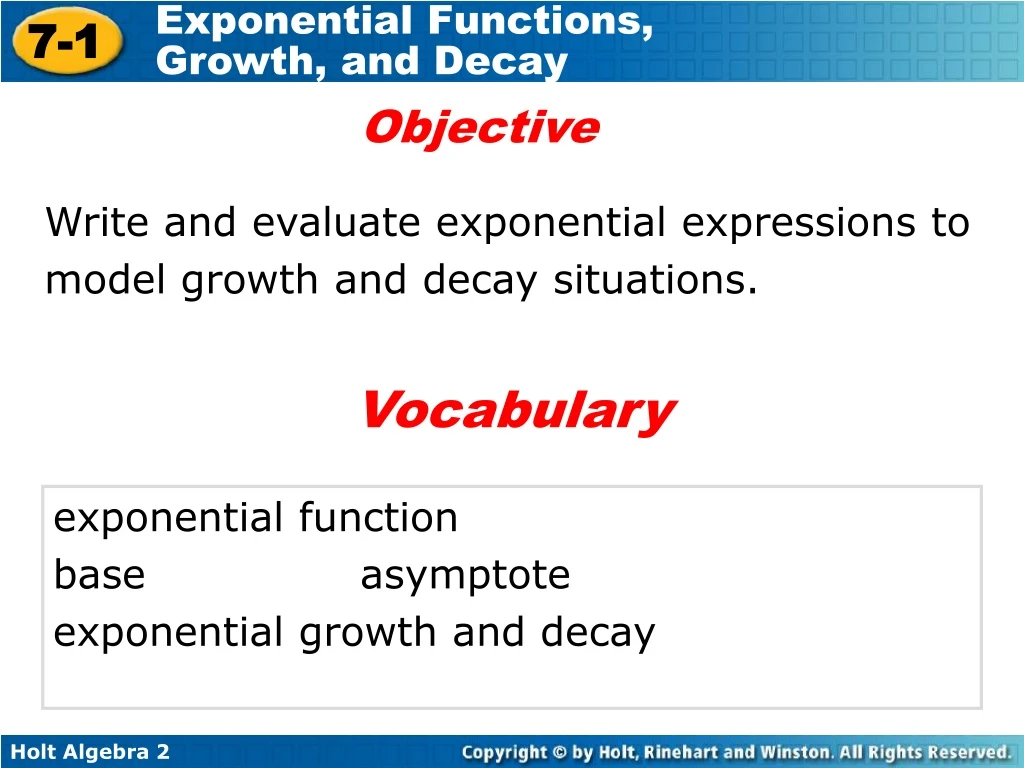
Objective Write and evaluate exponential expressions to model growth and decay situations. Vocabulary exponential function base asymptote exponential growth and decay
Notes In 2000, the world population was 6.08 billion and was increasing at a rate 1.21% each year. 1. Write a function for world population. Does the function represent growth or decay? 2. Predict the population in 2020. The value of a $3000 computer decreases about 30% each year. 3. Write a function for the computer’s value. Does the function represent growth or decay? 4. Predict the value in 4 years.
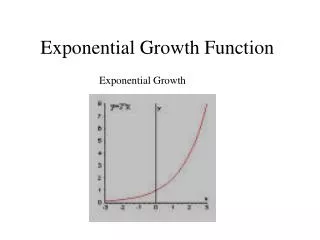
Growth that doubles every year can be modeled by using a function with a variable as an exponent. This function is known as an exponential function. The parent exponential function is f(x) = bx, where the baseb is a constant and the exponent x is the independent variable.
The graph of the parent function f(x) = 2xis shown. The domain is all real numbers and the range is {y|y > 0}.
Notice as the x-values decrease, the graph of the function gets closer and closer to the x-axis. The function never reaches the x-axis because the value of 2xcannot be zero. In this case, the x-axis is an asymptote. An asymptote is a line that a graphed function approaches as the value of x gets very large or very small.
A function of the form f(x) = abx, with a > 0 and b > 1, is an exponential growth function, which increases as x increases. When 0 < b < 1, the function is called an exponential decay function, which decreases as x increases.
Remember! Remember! Negative exponents indicate a reciprocal. For example: In the function y = bx, y is a function of x because the value of ydepends on the value of x.
The base , ,is less than 1. This is an exponential decay function. Example 1A: Graphing Exponential Functions Tell whether the function shows growth or decay. Then graph. Step 1 Find the value of the base.
Example 1A Continued Step 2 Graph the function by using a table of values.
Example 1B: Graphing Exponential Functions Tell whether the function shows growth or decay. Then graph. g(x) = 100(1.05)x Step 1 Find the value of the base. The base, 1.05, is greater than 1. This is an exponential growth function. g(x) = 100(1.05)x
Example 1C Tell whether the function p(x) = 5(1.2x) shows growth or decay. Then graph. Step 1 Find the value of the base. p(x) = 5(1.2x) The base , 1.2, is greater than 1. This is an exponential growth function.
Example 1C Continued Step 2 Graph the function by using a table of values.
You can model growth or decay by a constant percent increase or decrease with the following formula: In the formula, the base of the exponential expression, 1 + r,is called the growth factor. Similarly, 1 – ris the decay factor.
Example 2A: Economics Application Clara invests $5000 in an account that pays 6.25% interest per year. What will her investment be worth in seven years? Step 1 Write a function to model the growth in value of her investment. f(t) = a(1 + r)t Exponential growth function. f(t) = 5000(1 + 0.0625)t Substitute 5000 for a and 0.0625 for r. f(t) = 5000(1.0625)t Simplify.
Example 2A: Economics Application Clara invests $5000 in an account that pays 6.25% interest per year. What will her investment be worth in seven years? Step 2 Use function to evaluate at t = 7. f(t) = 5000(1.0625)t Substitute 7 for t.
Example 2B In 1981, the Australian humpback whale population was 350 and increased at a rate of 14% each year since then. Write a function to model population growth. P(t) = a(1 + r)t Exponential growth function. P(t) = 350(1 + 0.14)t Substitute 350 for a and 0.14 for r. P(t) = 350(1.14)t Simplify.
Example 3: Depreciation Application A city population, which was initially 15,500, has been dropping 3% a year. Write an exponential function. What will the population be after ten years? f(t) = a(1 – r)t Exponential decay function. Substitute 15,500 for a and 0.03 for r. f(t) = 15,500(1 – 0.03)t f(t) = 15,500(0.97)t Simplify. f(t) = 15,500(0.97)10=11,430 t=10 for ten years.
Notes In 2000, the world population was 6.08 billion and was increasing at a rate 1.21% each year. 1. Write a function for world population. Does the function represent growth or decay? P(t) = 6.08(1.0121)t 2. Use a graph to predict the population in 2020. ≈ 7.73 billion The value of a $3000 computer decreases about 30% each year. 3. Write a function for the computer’s value. Does the function represent growth or decay? V(t)≈ 3000(0.7)t ≈ $720.30 4. Use a graph to predict the value in 4 years.
Notes (continued) 5. Tell whether the function shows growth or decay. Then graph. f(x) = 8(½)x