Download
1 / 19
190 likes | 313 Vues
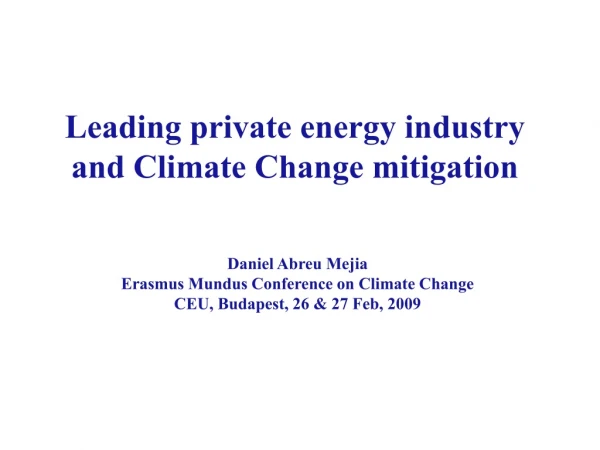
Energy Intensity, Climate Change and Coping Strategies for the Aluminum Industry. Subodh K. Das Executive Director Center for Sustainable Aluminum Industry University of Kentucky Lexington KY, USA skdas@secat.net April 9 – 10, 2008 West Virginia University Morgantown, West Virginia.

E N D
Energy Intensity, Climate Change and Coping Strategies for the Aluminum Industry Subodh K. Das Executive Director Center for Sustainable Aluminum Industry University of Kentucky Lexington KY, USA skdas@secat.net April 9 – 10, 2008 West Virginia University Morgantown, West Virginia
Introduction to Center for a Sustainable Aluminum Industry (CSAI) • Founded in Jan. 2005 • Funded by several sources: • Sloan Foundation Industry Centers Program • Arco Aluminum, Aleris International, Wise Alloys, Nichols Aluminum, Logan Aluminum, Ormet, Hydro Aluminum, Century Aluminum • The Commonwealth of Kentucky • The University of Kentucky
Aluminum Industry • The world produces 35 million metric tonnes of primary aluminum per year • US produces 6 million metric tonnes of primary aluminum and consumes a total of 12 million metric tonnes aluminum • Over 120,000 employed in the US aluminum industry • The contribution to US GDP is $40 billion a year • Electricity constitutes 30 to 40% of aluminum primary production cost, electricity prices pegged to LME • US remains the largest producer, importer, recycler and consumer of aluminum products. • New primary aluminum constructions are outsides the US: in China, India, Middle East
Outline • Aluminum –“Energy Bank” • High and Volatile Energy Costs • Critical Competitiveness Issues Facing Aluminum Industries • Coping Strategies • Future Research and Development Needs • Impact of Aluminum Industry on Greenhouse Gases
Aluminum –“Energy Bank” • Primary: Al – 45 kWh/kg Secondary: Al – 2.8 kWh/kg 251 Billionkwh (857 TrillionBTU) More than 1% of all U.S. energy use More than 3% of all U.S. manufacturing energy use
Competitiveness Issues Facing Aluminum Industry • The competing materials: • Steel, magnesium, and composites: Automotive and aerospace • PET: packaging • Vinyl: building and construction • High and volatile energy cost • Climate change issues • Limited R&D activities for process and product development
Coping Strategies • Improve energy efficiency of current processes • Develop innovative and new products • Enhance aluminum recycling
Future R&D Needs - (1)Primary Production • Modeling to improve the processing practice. • Continue development of wetted, drained cathode technology. • Develop continuous or semi-continuous sensors to cost-effectively measure alumina, superheat, temperature, and bath ratio. • Develop alternate cell concepts (combination of inert anodes and wetted, drained cathodes) to include variable and peak energy load.
Future R&D Needs - (2)Melting, Solidification, Fabrication • Develop an integrated process model to improve energy efficiency and product quality. • Develop low energy strip/slab casting technologies to improve surface quality and texture control.
Future R&D Needs - (3)New Product Design and Application • Develop advanced forming techniques to manufacture net shapes. • Develop integrated numerical methods for analysis and robust design of products, processes, and materials. • Develop recycle friendly aluminum alloys. • Develop low-cost joining techniques for similar and dissimilar materials.
Impact of Aluminum Industry on Greenhouse Gases • Aluminum is responsible for 1% of global human induced greenhouse gases (Carbon Dioxide and Perfluoro Carbons) • 1 kg Perfluoro Carbons (PFC) is equivalent to 6500 kg CO2 • 32 million metric tonnes primary aluminum production worldwide • Carbon Dioxide (CO2) • 15.6 kg CO2 per kg of aluminum production • Mining, refining, anode, electrolysis, and electric power generation • 453.8 billion metric tonnes CO2 per year for worldwide production • Perfluoro Carbons (PFC) • 1.0 kg PFC per tonne of aluminum production • 32 thousand metric tonnes PFC per year for worldwide production • Equivalent to 208 million metric tonnes of CO2
Process Improvements • Production of electricity • Use electricity from efficient coal/oil/natural gas power plants • Use renewable energy sources • Hydro (current world use ~50%), Geothermal, and Nuclear • Enhancement of process efficiency in existing plants and develop new technology • Replace rotary with fluid bed calciners • In the last 50 years, the average amount of electricity needed to make a pound of aluminum has been reduced from 12 kilowatt hours to about 7 kilowatt hours • Lower smelting energy consumption • Wettable/drained cathode • Lower carbon consumption • Inert anode • Eventually develop more efficient vertical electrode cell • Lower anode effect frequency (reduce PFC) • Develop non-contact sensors
Promote Aluminum Uses in Transportation • Lightweighting in aircraft, rail, shipping and especially cars and trucks saves fuel, and reduces CO2 emissions • Each pound of Al replacing iron or steel saves 20 pounds of CO2 emissions over an average vehicle lifetime • Fuel savings of 6-8% can be gained for every 10% weight reduction of a vehicle, resulting in less GHG emissions • EPA estimates ~90% of automotive aluminum is recovered and recycled
North American Light Vehicle Aluminum Content Changes North American Total Aluminum Content (Pounds per Vehicle)
Recycling • Promote recycling of aluminum products • Recycling saves ~95% of energy AND emissions as compared to primary production • Enhance recycled aluminum melting efficiency • Implement new recycling/sorting technologies • Consider urban mining of Used Beverage Cans (UBCs) • US recycling rate ~ 50% (Brazil, Norway ~ 96%) • Accumulated landfill totals 20 million tons in the US • Total value of “urban mine” is $50 billion in the US • New landfill equals 3 aluminum smelters output (~900,000 tonnes per year in the US) • Develop recycle-friendly aluminum alloys for • Aerospace, Automotive, Building & Construction • Secondary benefit of lower carbon footprint from alloying elements
Why Recycle Aluminum Can? 1% change in recycling rate has an economic impact of approximately $16 million Trashed cans contribute about $800 million to the nation’s trade deficit each year National Aluminum Beverage Can Recycling Rate Trends.
Carbon Trading • Materials flow modeling indicates that by 2020, the Aluminum industry will have a negative carbon footprint • Suggested commercial and technical actions: • Urge aluminum companies to enhance recycling rate in liu of constructing new aluminum smelters in energy and/or consumption rich countries such as Middle East and Iceland (energy rich) and China and India (consumption rich) • Ratio of new construction to new recycling recovery is 1:20 • Promote carbon trading replacing new smelting construction with new recycling activities
Aluminum Industry Flow Chart Production Carbon Trading End Use Recycling
Thank you ! Subodh K. Das Executive Director Center for Sustainable Aluminum Industry University of Kentucky Lexington KY, USA skdas@secat.net