Efficient Lateral Force Calibration Method Using Mean-Value Approach
180 likes | 285 Vues
This major project explores a innovative mean-value method for calibrating lateral forces in various materials. The research aims to address common problems in lateral force microscopy calibration methodologies, such as the need for specialized equipment and time-consuming procedures. Samples tested include piano wire, steel rod, solder spheres, and Si3N4 ball bearings. Experimental difficulties encountered include finding smooth surfaces and crosstalk between lateral and normal force signals. By employing mean-value analysis, a high degree of linearity (R2=0.961) was achieved, validating the proof of concept. The project's findings will be further developed by Saonti Chakraborty and published in a peer-reviewed journal.

Efficient Lateral Force Calibration Method Using Mean-Value Approach
E N D
Presentation Transcript
A Major Qualifying Project By Derek Eggiman Mean-Value Method of Lateral Force Calibration
Acknowledgments • We would like to thank Sigma-Xifor generously funding this project. • We would also like to thank Professor Nancy Burnham and Dr. Deli Liu.
Many studies assume a functional form for friction, f=μ(N+A). • Other methods calibrate as a function of load. • Repeated scans • Excess tip wear. • Other methods require special equipment or are far to complicated and time consuming. • Want quick, in-situ method. Current Problems in LFM Calibration
MethoDology • Equilibrium equations depend on direction of motion (Vx) and angle (θ). • Taking the average value of scans in opposite directions over the same surface results in cancelations. • Flat-avg= Floadtan(θ) or • Vlat-avg= αFloadtan(θ)
Samples:Tested • Piano wire • Steel rod • Solder spheres • 1.588 mm diameterSi3N4 ball bearings http://www.satotekkou.co.jp/en/product/img/ceramic-p04.jpg
Experimental Difficulties • Finding a sufficiently smooth surface • Lack of lateral force sensitivity • Crosstalk of lateral and normal force signals
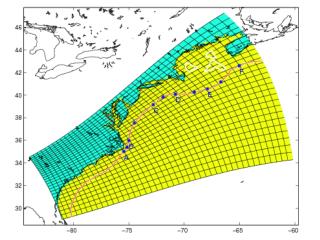
Obtained by taking a complete image of 256X256 data points in a 27 X 27 (μm) scan range. • Then taking the mean value along the y axis and using this data to perform our analysis. • Plotted the mean value of: • Topography (μm) • LFM Forward • LFM Reverse Full scan Mean-value analysis
Mean value of 256 X 256 point scan shows high degree of linearity. R2=0.961. Successfully derived proof of concept. Work will be continued by SaontiChakraborty and published in a peer reviewed journal. Conclusions
Questions? http://www.phdcomics.com/comics/archive.php?comicid=771