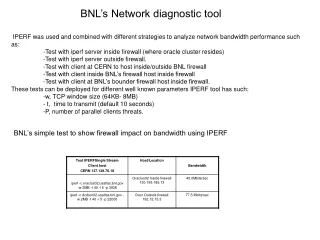
Download
1 / 41
410 likes | 436 Vues
Develop a comprehensive diagnostic tool, NDT, focusing on analyzing connection performance by combining Web100 variables into network signatures. Funded by NSF, this project automates network tuning to enhance application performance.

E N D
Developing the Web100 Based Network Diagnostic Tool (NDT) SC’04 Conference November 9-11 , 2004 Rich Carlson RCarlson@internet2.edu
Motivation for work • Develop “single shot” diagnostic tool that doesn’t use historical data • Measure performance to users desktop • Combine numerous Web100 variables to analyze connection • Develop network signatures for ‘typical’ network problems
Web100 Project • Joint PSC/NCAR project funded by NSF • ‘First step’ to gather TCP data • Kernel Instrument Set (KIS) • Requires patched Linux kernel • Geared toward wide area network performance • Future steps will automate tuning to improve application performance
NDT’s Web100 Based Approach • Simple bi-directional test to gather E2E data • Gather multiple data variables from server • Compare measured performance to analytical values • Translate network values into plain text messages • Geared toward campus area network
NDT Benefits • End-user based view of network • Can be used to identify performance bottlenecks (could be host problem) • Provides some ‘hard evidence’ to users and network administrators to reduce finger pointing • Doesn’t rely on historical data
Web Based Performance tool • Operates on Any client with a Java enabled Web browser • What it can do • Positively state if Sender, Receiver, or Network is operating properly • Provide accurate application tuning info • Suggest changes to improve performance
Web base Performance tool • What it can’t do • Tell you where in the network the problem is • Tell you how other servers perform • Tell you how other clients will perform
Internet2 piPEs Project • Develop E2E measurement infrastructure capable of finding network problems • Tools include • BWCTL: Bandwidth Control wrapper for NLANR Iperf • OWAMP: One-Way Active Measurement • NDT: Network Diagnostic Tool
NDT methodology • Identify specific problem(s) that affect end users • Analyze problem to determine ‘Network Signature’ for this problem • Provide testing tool to automate detection process
Bottleneck Link Detection • What is the slowest link in the end-2-end path? • Monitors packet arrival times using libpacp routine • Use TCP dynamics to create packet pairs • Quantize results into link type bins (no fractional or bonded links) Cisco URP grant work
Duplex Mismatch Detection • Developing analytical model to describe how network operates (no prior art?) • Expanding model to describe UDP and TCP flows • Test models in LAN, MAN, and WAN environments NIH/NLM grant funding
Faulty Hardware/Link Detection • Detect non-congestive loss due to • Faulty NIC/switch interface • Bad Cat-5 cable • Dirty optical connector • Preliminary works shows that it is possible to distinguish between congestive and non-congestive loss
Full/Half Link Duplex setting • Detect half-duplex link in E2E path • Identify when throughput is limited by half-duplex operations • Preliminary work shows detection possible when link transitions between blocking states
Normal congestion detection • Shared network infrastructures will cause periodic congestion episodes • Detect/report when TCP throughput is limited by cross traffic • Detect/report when TCP throughput is limited by own traffic
Additional Functions and Features • Provide basic tuning information • Basic Features • Basic configuration file • FIFO scheduling of tests • Simple server discovery protocol • Federation mode support • Command line client support • Created sourceforge.net project page
SC’04 Real Life Example • Booth having trouble getting application to run from Amsterdam to Pittsburgh • Tests between remote SGI and local PC showed throughput limited to < 20 Mbps • Assumption is: PC buffers too small • Question: How do we set WinXP send/receive buffer
SC’04 Determine WinXP info http://www.dslreports.com/drtcp
SC’04 Confirm PC settings • DrTCP reported 16 MB buffers, but test program still slow, Q: How to confirm? • Run test to SC NDT server (PC has Fast Ethernet Connection) • Client-to-Server: 90 Mbps • Server-to-Client: 95 Mbps • PC Send/Recv Buffer size: 16 Mbytes (wscale 8) • NDT Send/Recv Buffer Size: 8 Mbytes (wscale 7) • Reported TCP RTT: 46.2 msec • approximately 600 Kbytes of data in TCP buffer • Min buffer size / RTT: 1.3 Gbps
SC’04 Local PC Configured OK • No problem found • Able to run at line rate • Confirmed that PC’s TCP buffers were set correctly
SC’04 Remote SGI • Run test from remote SGI to SC show floor (SGI is Gigabit Ethernet connected). • Client-to-Server: 17 Mbps • Server-to-Client: 16 Mbps • SGI Send/Recv Buffer size: 256 Kbytes (wscale 3) • NDT Send/Recv Buffer Size: 8 Mbytes (wscale 7) • Reported RTT: 106.7 msec • Min Buffer size / RTT: 19 Mbps
SC’04 Remote SGI Results • Needed to download and compile command line client • SGI TCP buffer is too small to fill transatlantic pipe (19 Mbps max) • User reluctant to make changes to SGI network interface from SC show floor • NDT client tool allows application to change buffer (setsockopt() function call)
SC’04 Remote SGI (tuned) • Re-run test from remote SGI to SC show floor. • Client-to-Server: 107 Mbps • Server-to-Client: 109 Mbps • SGI Send/Recv Buffer size: 2 Mbytes (wscale 5) • NDT Send/Recv Buffer Size: 8 Mbytes (wscale 7) • Reported RTT: 104 msec • Min Buffer size / RTT: 153.8 Mbps
SC’04 Debugging Results • Team spent over 1 hour looking at Win XP config, trying to verify Buffer size • Single NDT test verified this in under 30 seconds • 10 minutes to download and install NDT client on SGI • 15 minutes to discuss options and run client test with set buffer option
SC’04 Debugging Results • 8 Minutes to find SGI limits and determine maximum allowable buffer setting (2 MB) • Total time 34 minutes to verify problem was with remote servers’ TCP send/receive buffer size • Network path verified but Application still performed poorly until it was also tuned
Well Known NDT Server Web Request NDT - Server Client Redirect msg Web Browser Web Server Web Page Request Web page response Testing Engine Java Applet Test Request Control Channel Spawn child Child Test Engine Specific test channels NDT Flow Chart
Availability • Open Source Development project • http://www.sourceforge.net/projects/ndt • Tools available via from • http://e2epi.internet2.edu/ndt/download.html • Contains source code • Email discussion list ndt-users@internet2.edu • Goto http://e2epi.internet2.edu/ndt web site and click • ndt-users – General discussion on NDT tool • ndt-announce – Announcements on new features
Demo http://140.221.255.74
Demo http://miranda.ctd.anl.gov:7123
Results and Observations • Real time debugging on the SC’04 show floor • Demo
Obtaining the test results • Runs 10 sec test from Client to Server • no diagnostic data collected • Runs 10 sec test from Server to Client • Web100 diagnostic data collected at end of test • Prints out summary status message • Link speed and duplex • Informational or Warning messages
Analyzing the test results • Statistics button • Send and Receive throughput achieved • Details for 5 configuration tests (link type, duplex mode, congestion, excessive errors, duplex mismatch condition) • Throughput limits section (%S-R-N limited, RTT, %loss, %out-of-order) • ‘Tweakable’ settings (TCP modifications to improve performance)
Analyzing the test results • More Details button • Individual TCP counters collected by Web100 • Conditional test parameters • Throughput analysis section including theoretical limits, bandwidth*delay products, loss rate, and buffer sizes
Analyzing the test results • Report Problem button • Invokes local email client <mailto:> • Automatically inserts collected data into body of email • Provides “comment” section for user feedback • Server logs all counter variables used for condition tests
Results and Observations • Changing desktop effects performance • Faulty Hardware identification • Mathis et.al formula fails • Demo
Different Host, Same Switch Port Different HW same Network port • 10 Mbps NIC • Throughput 6.8/6.7 Mbps send/receive • RTT 20 ms • Retransmission/Timeouts 25/3 • 100 Mbps NIC • Throughput 84/86 Mbps send/receive • RTT 10 ms • Retransmission/Timeouts 0/0
100 Mbps FD Ave Rtt %loss 5.41 0.00 1.38 0.78 6.16 0.00 14.82 0.00 10 Mbps 72.80 0.01 8.84 0.75 Speed 94.09 22.50 82.66 33.61 6.99 7.15 Effect of Faulty HW & Congestion LAN Testing Results
100 Mbps FD Ave Rtt %loss loss/sec 5.41 0.00 0.03 1.38 0.78 15.11 6.16 0.00 0.03 14.82 0.00 0.10 10 Mbps 72.80 0.01 0.03 8.84 0.75 4.65 Speed 94.09 Good 22.50 Bad NIC 82.66 Bad reverse 33.61 Congestion 6.99 Good 7.15 Bad NIC Effect of Faulty HW & Congestion LAN Testing Results
Mathis et.al Formula fails • Estimate = (K * MSS) / (RTT * sqrt(loss)) • old-loss = (Retrans - FastRetran) / (DataPktsOut - AckPktsOut) • new-loss = CongestionSignals / PktsOut • Estimate < Measured (K = 1) • old-loss 91/443 (20.54%) • new-loss 35/443 (7.90%)