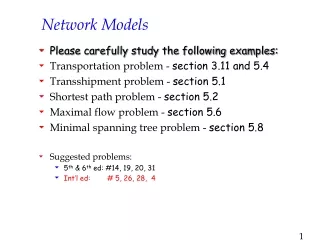
Network Models
Network Models. Robert Zimmer Room 6, 25 St James. Introduction to Network Modeling . General Problems in Network Modeling Transportation Problems Assignment Problems Minimum Cost Flow Problems Shortest Path Problems Maximum Flow Problems Critical Path in Project Plan Networks.

Network Models
E N D
Presentation Transcript
Network Models Robert Zimmer Room 6, 25 St James
Introduction to Network Modeling General Problems in Network Modeling • Transportation Problems • Assignment Problems • Minimum Cost Flow Problems • Shortest Path Problems • Maximum Flow Problems • Critical Path in Project Plan Networks
5.1 Introduction • Reasons to distinguish network models from other LP models • Network structure of these models allows us to represent them graphically. • Many companies have real problems that can be represented as network models. • Specialized solution techniques have been developed specifically for network models.
5.2 Transportation Models • Companies produce products at locations called origins and ships these products to customer locations called destinations. • Each origin has a limited amount that it can ship, and each customer destination must receive a required quantity of the product. • Only possible shipments are those directly from an origin to a destination. • These problems are generally called transportation problems.
Example 5.1 – Transportation Problem • The company manufactures automobiles in three plants and then ships them to four regions of the country. • Grand Prix wants to find the lowest-cost shipping plan for meeting the demands of the four regions without exceeding capacities of the plants. • The company must decide exactly the number of autos to send from each plant to reach region – a shipping plan.
Ex. 5.1(cont’d) – Transportation Problems • A typical transportation problem requires three sets of numbers: • Capacities (or supplies) – indicates the most each plant can supply in a given amount of time. • Demands ( or requirements) – typically estimated from some type of forecasting model. Often demands are based on historical customer demand data. • Unit shipping (and possibly production) costs – come from a transportation cost analysis.
Ex. 5.1(cont’d) – Network Model • This model is typical of network models.
Ex. 5.1(cont’d) – Network Model • A node, indicated by a circle, generally represents a geographical location. • An arc, indicated by an arrow, generally represents a route for getting a product from one node to another. • The decision variables are usually called flows. They represent the amounts shipped on the various arcs. • Upper limits are called arc capacities, and they can also be shown on the model.
Ex. 5.1(cont’d) – Developing the Model • To develop this model, proceed as follows. • Inputs. Enter the unit shipping costs, plant capacities region demands in the shaded ranges. • Shipping Plan. Enter any trial values for the shipments from each plant to each regions in the Shipping_plan range. • Numbers shipped from plants. Need to calculate the amount shipped out of each plant with row sums in the range G13:G15. • Amounts received by regions. Calculate the amount shipped to each region with columns sums in the range C16:F16. • Total shipping cost. Calculate the total cost of shipping power. TotalCost cell with the formula =SUMPRODUCT(C6:F8,Shipping_plan). • Invoke the Solver with the appropriate settings.
Ex. 5.1(cont’d) – Spreadsheet Model • A good shipping plan tries to use cheap routes, but it is constrained by capacities and demands. • It is typical in transportation models, especially large models, that only a relatively few of the possible routes are used.
Ex. 5.1(cont’d) – Sensitivity Analysis • Many sensitivity analyses could vary any one of the unit shipping costs, capacities, or demands. Many of these would use Solver’s sensitivity report. • One interesting analysis that cannot be performed with Solver’s tool is to keep shipping costs and capacities constant and allow all of the demands to change by a certain percentage. • Use SolverTable, with varying percentages as the single input. • The key to doing this correctly is to modify the model slightly before running SolverTable.
Ex. 5.1(cont’d) – Alternative Model • An arc pointed into a node is called an inflow. An arrow pointed out of a node is called an outflow. • General networks can have both inflows and outflows for any given node. • Typical network models have one changing cell per arc. • It is useful to model network problems by listing all of the arcs and their corresponding flows in one long list. Constraints are placed in a separate section. • For each node in the network, there is a flow balance constraint.
Ex. 5.1(cont’d) – Alternative Model • An easy way to enter these summation formulas is to use Excel’s SUMIF function, in the form =SUMIF(CompareRange,Criteria,SumRange). • SUMIF function is useful for summing values in a certain range if cells in a related range satisfy given conditions.
Ex. 5.1(cont’d) – Alternative Model • An additional benefit from this model formulation is that it makes it easy to disallow routes. • This is very valuable when the number of potential arcs in the network is huge – even though the vast majority of them are disallowed – and this is exactly the situation is most large network models. • Some modeling issues to note include: • How the demand constraints are expressed ( “>=” or “<=” or “=”) depends on the context of the problem. • If all supplies and demands are integers it is not necessary to add explicit integer constraints. This allows us to use the “fast” simplex method. • Shipping costs are often nonlinear due to quantity discounts. • There is a streamlines version of the simplex method designed for transportation problems, called the transportation simplex method.
Example 5.2 – Extended Transportation Problem • Grand Prix now not only ships the autos, but it manufactures them at the plants and sells them in the various regions. • Their market is now an international market. The effect is that the unit production costs vary according to the plant: • Selling prices vary by region • Tax rates on profits vary according to the plant at which the autos are produced
Ex. 5.2(cont’d) – Extended Transportation Problem • The company now needs to find a production and shipping plan that maximizes its after-tax profit. • An additional calculation is needed to determine after-tax profit per automobile produced in a given plant and sold in a given region. • It is straightforward to calculate the total after-tax profit from any production/shipping plan, and this becomes the objective to maximize.
Ex. 5.2(cont’d) – Spreadsheet Model • Only four of the possible twelve routes, and, possibly surprisingly, these are not the four routes with the largest until after-tax profits.
Ex. 5.2(cont’d) – Developing the Model • Two steps are needed to extend the model: • Unit after-tax profits: After tax profit is the unit selling price minus the production cost minus the shipping cost, all multiplied by 1 minus the tax rate. The formula is cell B26 is =(C$11-$H7-C7)*(1-$I7) • Total after-tax profit: Calculate the total after-tax profit in cell B31 with the formula =SUMPRODUCT(C26:F28,Shipping_plan) • Don’t forget to check the Maximize option.
5.3 Assignment Models • Assignment models are used to assign, on a one-to-one basis, members of one set to members of another set in a least-cost (or least-time) manner. • Assignment models are special cases of transportation models where all flows are 0 or 1. • It is identical to the transportation model except with different inputs. • The only minor difference is that the demand constraints “=” constraints, because each job must be completed exactly once.
5.4 Minimum Cost Network Flow Models • The simplest models include a single product that needs to be shipped via one mode of transportation. • More complex problems can include multiple products, multiple modes of transportation, and/or multiple time periods – these are referred to as minimum cost network flow problems. • Two possible differences distinguish these problems from transportation problems. • Arc capacities are often imposed on some or all of the arcs • There can be inflows and outflowsassociated with any node. • Nodes are generally categorized as • Suppliers – a location that starts with a certain supply • Demanders – the opposite of a supplier, it requires a certain amount to end up there • Transshipment points – a location where goods simply pass through
Net inflow for any node is defined as total inflow minus total outflow for the node. • Net outflow is the negative of this, total outflow minus total inflow. • There are typically two types of constraints in minimum cost network flow models. • First type represents the arc capacity constraints, which are simple upper bounds on the arc flows. • Second type represents the flow balance constraints. • For a supplier it is Net Outflow=Original Supply or Net Outflow<=Capacity. • For a demander it is Net Inflow>=Demand or Net Inflow=Demand. • For a transshipment point it is Net Inflow=0 (which is equivalent to Net Outflow=0)
Example 5.4 – Minimum Cost Network Flow Model • RedBrand produces a tomato product at three plants. • The product can be shipped directly to the two customers or to the company’s two warehouses and then to customers. • Arcs with arrows at both end indicate that flow is allowed in either direction.
Ex. 5.4(cont’d) – Developing the Model • RedBrand is concerned with minimizing the total shipping cost incurred in meeting customer demands. • The key to the model is handling the flow balance constraints. • To setup the spreadsheet model: • Origins and destinations. Enter the node numbers for the origins and destinations of the various arcs. • Input data. Enter the unit shipping costs, common arc capacity, plant capacities, and the customer demands. • Flows on arcs. Enter any initial values for the flows in the range D8:D33.
Ex. 5.4(cont’d) – Developing the Model • Arc capacities. Enter =$B$4 in cell F8 and copy it down column F. • Flow balance constraints. Enter the net outflow for node 1 in cell I9 with the formula =SUMIF(Origin,H9,Flow)-SUMIF(Destination,H9,Flow) and copy it down to cell I11. Enter the net inflow for node 6 in cell I20 with the formula =SUMIF(Destination,H20,Flow)-SUMIF(Origin,H20,Flow) and copy it to cell I21. • Total shipping cost. Calculate total shipping cost in cell B36 with the formula =SUMPRODUCT(Unit_Cost,Flow) • Want to minimize total shipping costs, subject to the three types of flow balance constraints and the arc capacity constraints.
Ex. 5.4(cont’d) – Sensitivity Analysis • How much effect does the arc capacity have on the optimal solution? • Use SolverTable to see how sensitive this number and the total cost are to the arc capacity. • To keep track of an output that does not already exist, an appropriate formula in a new cell must be created before running SolverTable. • The formula in cell C39 is =COUNTIF(Flow,B4). • The COUNTIF counts the number of values in a given range that satisfy some criterion. The syntax is =COUNTIF(range, criterion).
Ex. 5.4(cont’d) – Sensitivity Analysis & Variations • As the arc capacity decreases, more flows bump up against it, and the total cost increases. • Two possible variations on this model. • Suppose RedBrand ships two products along the give network. These products would compete for arc capacity. • Separate production capacity for each product, and each customer has a separate demand for each product.
Ex. 5.4(cont’d) – Variations • For this variation you must • have two columns of changing cells • apply the previous logic to both products separately in the flow balance constraints • apply the arc capacities to the total flows in column F. • Capacity constraints for both products with the single entry Plant_net_outflow<=Plant_capacity in the Solver dialog box.
Ex. 5.4(cont’d) – Variations • A second variation is appropriate for perishable goods, such as fruit. • Total inflow to a warehouse is greater than the total outflow from the warehouse. • The model shows a “shrinkage factor” in cell B5, the percentage that does not spoil in the warehouses, becomes a new input. • Then it is incorporated into the warehouse flow balance constraints by entering the formula =SUMIF(Origin,H16,Flow)-$b$5*SUMIF(Destination,H16,Flow) in cell I16 and copying to cell I17.
Modeling Issues • The network simplex method is much more efficient than the ordinary simplex method. • Large network problems are solved using this method. • If the nodes and the arc capacities are integers, then integer solutions are available “for free” without having to use an integer programming algorithm. This is only true for the “basic” network flow model.
5.5 Shortest Path Models • Shortest path models find the shortest path between two points in a network. • Sometimes these problems are geographical but there are other problems that do not look like shortest path problems that can be modeled in the same way.
Example 5. 6 – Equipment Replacement Model • VanBuren Metals is a manufacturing company that uses large machines that require frequent maintenance. • VanBuren often finds it advantageous from a cost standpoint to replace machines rather than continue to maintain them. • For one class of machines the company has estimated maintenance costs, salvage value and replacement cost. • VanBuren would like to devise a strategy for purchasing machines over the next 5 years.
Ex. 5.6 (cont’d) – The Solution • Can be modeled as a shortest path model • Two keys to understanding why this is possible • the meaning of nodes and arcs • the calculation of costs on arcs • Beyond these the network is a typical shortest path model
Ex. 5. 6 (cont’d) – The Network • An arc from any node to a later code corresponds to keeping a machine for a certain period of time and then trading it in for a new machine. • An arc cost is a sum of the maintenance cost minus a salvage value plus the cost of a new machine.
Ex. 5. 6 (cont’d) – Developing the Model • The model can be completed with the following steps: • Inputs. Enter any inputs for purchase cost, maintenance cost, and salvage value in the shaded ranges. • Arcs. In the bottom section, columns A and B indicate the arcs in the network. Enter these “origins” and “destinations” manually. • Quarters to keep. Calculate the differences between the values in column B and A in column C. • Maintenance costs. Calculate the quarterly maintenance costs in column D through O by entering the formula =IF(D$13>$C14,0,$B$6+$B$7*(D$13-1)) in cell D14 and copying it to the range D14:O130.
Ex. 5. 6 (cont’d) – Developing the Model • Salvage values. Calculate the salvage values in column P by entering the formula =$B$9-$B$10*(C14-1) in cell P14 and copying it down column P. • Purchase cost. The purchase cost of a new machine never changes, so put an absolute link to cell B4 in cell Q14 and copy it down column Q. • Total arc costs. Calculate the total costs on the arcs as total maintenance cost minus salvage value plus purchase cost. Enter the formula =SUM9D14-O14)-P14+Q14 in cell R14, and copy it down column R. • Flows. Enter any flows on the arcs in column S.
Ex. 5.6 (cont’d) – Solver, Solution and Modeling Issues • The model is developed exactly as in the shortest path model. • Use Solver to find the shortest path and follow the 1’s in the Flow range to identify the optimal equipment replacement policy. • Modeling issues • There is no inflation in this model. • Forced to resell the current machine and buy a new one at the end of the 5 year period.
5.6 Project Scheduling Models • Network models can be used to help schedule large, complex projects that consist of many activities. • Begin with a list of the activities that comprise the project. • Each activity has a set of activities called its immediate predecessors that must be completed before the activity begins. • They also each have a set of activities called their immediate successors that cannot start until it has finished.
A project network diagram is usually used to represent the precedence relationships among activities. • Two types of diagrams do this, activity-on-node (AON) and activity-on-arc (AOA). • In the AON representation of a project, there is a node for each activity. • AON networks use nodes for activities and arcs to indicate precedence relationships. • They can be represented in a table and on a network diagram.
Rules for drawing an AON network • Include a node for each activity and place its duration next to the node • Include an arc from node i to node j only if node i is an immediate predecessor of node j. • Include a Start and a Finish node with zero durations • Typical problems analyzed in project scheduling • Find the time needed to complete the project and locate the “bottleneck” activities • Find cost-efficient ways to complete the project within a given deadline
An activity is critical if, by increasing its duration, the time to complete the project increases. • The critical path is the set of critical activities. • Approaches to project scheduling • Traditional approach – widespread in project scheduling field • Solver approach – follows naturally from the traditional approach but makes use of Solver • The earliest start time and earliest finish time for any activity are the earliest the activity could start or finish, given precedence relationships and durations. • The latest start time and latest finish time for any activity are the latest the activity could start or finish without delaying the project as a whole.
The slack of any activity is the amount of time the activity could be delayed beyond its earliest start time with out delaying the project as a whole. • An activity is critical only if is slack is 0. • The Solver approach uses the concepts as the traditional approach. • The starting times are the changing cells and minimize the start time of the finish node. • The constraint for each arc is Sj – Si ≥ dj , where activity i is an immediate predecessor of activity j, and Si and Sj are start times, and di is the duration.
Example 5.7 – Project Scheduling Model • Tom Lingley has agreed to build a new room on an existing house. • The work proceeds in stages, labeled A through J.
Ex. 5.7 (cont’d) • Lingely wants to know how long the project will take to complete, given the activity times. • He also wants to identify the critical activities.
Ex. 5.7 (cont’d) – Traditional Approach Model • The traditional approach used to find the critical activities and the project completion time does not require Solver.
Ex. 5.7 (cont’d) – Developing the Traditional Model • The traditional model is developed with these steps. • Input data. Enter the predecessors, successors, and durations in the shaded range. • Earliest start and finish times. Enter the formula =B20+E5 in cell C20 and copy it down to cell C31. Each earliest start time is the maximum of the earliest finish times of all predecessors. • Project completion time. In cell B33 enter the formula =B31. • Latest start and finish times. Enter the formula =D20-E5 in cell E20 and copy it down to cell E31 and then enter the formula =B33 in cells D31. Each latest finish time is the minimum of the latest start times of all successors. • Slacks. Enter the formula =E20-B20 in cell F20 and copy it down to cell F31.