Download
1 / 25
250 likes | 385 Vues
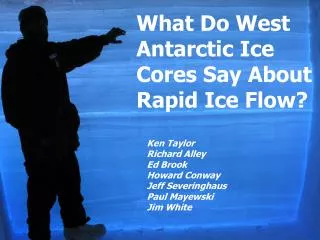
Towards a suite of US ITASE West Antarctic paleoclimate records. Daniel A. Dixon, P. A. Mayewski, S. Kaspari, S. Sneed, M. Handley, K. Maasch, K. Kreutz, G. Hamilton, A. Carleton. ACKNOWLEDGEMENTS: Office of Polar Programs, National Science Foundation, 109th Air National Guard,

E N D
Towards a suite of US ITASE West Antarctic paleoclimate records Daniel A. Dixon, P. A. Mayewski, S. Kaspari, S. Sneed, M. Handley, K. Maasch, K. Kreutz, G. Hamilton, A. Carleton ACKNOWLEDGEMENTS: Office of Polar Programs, National Science Foundation, 109th Air National Guard, Ice Core Drilling Services, Raytheon Polar Services.
U.S.ITASE TRAVERSES DOME-A INTERNATIONAL ITASE TRAVERSES
RAW xsSO4 (RED) AND ssSO4 (GREEN) CONCENTRATIONS FROM 1800-2002 AD
H Approx. Sea Level A.A.O. or S.A.M. EOF 1 (33%) EOF 2 (11%) A.S.L. Zonal Wave #3 EOF 3 (9%) EOF 1 (Modified from http://www.jisao.washington.edu/aao)
L L A.A.O. or S.A.M. EOF 1 (33%) EOF 2 (11%) A.S.L. Zonal Wave #3 EOF 3 (9%) • EOF 2 • Strong correlation in area of Amundsen Sea Low • Potential teleconnections to SOI • and Antarctic Dipole (Modified from http://www.jisao.washington.edu/aao)
L L A.A.O. or S.A.M. EOF 1 (33%) EOF 2 (11%) A.S.L. Zonal Wave #3 EOF 3 (9%) • EOF 2 • Strong correlation in area of Amundsen Sea Low • Potential teleconnections to SOI • and Antarctic Dipole (Modified from http://www.jisao.washington.edu/aao)
H L L L A.A.O. or S.A.M. EOF 1 (33%) EOF 2 (11%) A.S.L. Zonal Wave #3 EOF 3 (9%) • EOF 3 • Correlated with major circum-Antarctic lows and blocking high • Potential teleconnections to SOI • and Antarctic Circumpolar Wave (Modified from http://www.jisao.washington.edu/aao)
H L L L A.A.O. or S.A.M. EOF 1 (33%) EOF 2 (11%) A.S.L. Zonal Wave #3 EOF 3 (9%) • EOF 3 • Correlated with major circum-Antarctic lows and blocking high • Potential teleconnections to SOI • and Antarctic Circumpolar Wave (Modified from http://www.jisao.washington.edu/aao)
El Niño H L L http://www.cdc.noaa.gov/map/clim/sst_olr/el_nino_anim.shtml WEAKENED WALKER CIRCULATION Adapted from Cullather et al., (1996) • El Niño • A.S.L. moves towards Peninsula • Greater sea ice extent in Atlantic sector during El Niño(shown in red) Image courtesy: Claire Parkinson and Nick DiGirolamo, NASA
La Niña H L L http://www.cdc.noaa.gov/map/clim/sst_olr/el_nino_anim.shtml STRENGTHENED WALKER CIRCULATION Adapted from Cullather et al., (1996) • La Niña • A.S.L. moves away from Peninsula • Greater sea ice extent in Pacific sector during La Niña (shown in blue) Image courtesy: Claire Parkinson and Nick DiGirolamo, NASA
L Approx. Sea Level Adapted from Kreutz et al., (2000) and Mayewski et al., (2005) • ITASE 01-2 Na Correlated • to Surface Pressure in the • region of the A.S.L. • SD Na Correlated to • SON SLP from ECMWF • r=-0.32 (annual) to • r=-0.75 (3-year smooth) • P<0.001 (AD 1900-1995) From Mayewski et al., (2004)
H Approx. Sea Level Adapted from Souney et al., (2002) and Goodwin et al., (2003) • Wilkes Land NO3 Correlated to Winter SLP Gradient Between East • Antarctica and the Sub-Antarctic r=-0.52, p<0.005 (AD 1957-1984) • DSS Na Correlated to Winter (June) SLP Across EAIS • r=0.35-0.636 (for 11 Stations), p<0.05 (AD 1957-1996) From Mayewski et al., (2004)
WARMING COOLING Approx. Sea Level Adapted from Steig et al., (2000) and Van Ommen and Morgan, (1997) • 25-year running mean SD and DSS δ18O (‰) used as a proxy for temperature in coastal West- and East-Antarctica respectively • Estimated temperature developed from calibration with instrumental mean annual and seasonal temperature values From Mayewski et al., (2004)
L SEA ICE Approx Sea Level Adapted from Meyerson et al., (2002) • South Pole MS Positively Related to Amundsen/Ross (185-245ºE) Sea Ice Extent and SOI from AD 1973-1992 (Principal EOF results represent 47%, 65%, and 47% of each series respectively) MS From Mayewski et al., (2004)
H COOL L WARM El Niño data from Meyerson et al., (2002) Δ14C data from Stuiver and Braziunas, (1993) Maunder Minimum Spörer Minimum Wolf Minimum CO2 data from DSS ice core (Etheridge et al., 1998) Approx. Sea Level AD 1200-1700 From Mayewski et al., (2004)
L H Δ14C data from Stuiver and Braziunas, (1993) Maunder Minimum Spörer Minimum Wolf Minimum CO2 data from DSS ice core (Etheridge et al., 1998) Approx. Sea Level WARM COOL El Niño data from Meyerson et al., (2002) AD 1200-1700 • Periods of increased El Niño occurrence are relatively short • Encompasses the onset and majority of the Little Ice Age event • Solar variability decreases steadily (as indicated by Δ14C values) • CO2 concentrations fall steadily from 284ppm to 274ppm From Mayewski et al., (2004)
COOLING H L COOLING El Niño data from Meyerson et al., (2002) Δ14C data from Stuiver and Braziunas, (1993) Maunder Minimum Spörer Minimum Wolf Minimum CO2 data from DSS ice core (Etheridge et al., 1998) Approx. Sea Level AD 1700-1850 From Mayewski et al., (2004)
L H WARMING WARMING El Niño data from Meyerson et al., (2002) Δ14C data from Stuiver and Braziunas, (1993) Maunder Minimum Spörer Minimum Wolf Minimum CO2 data from DSS ice core (Etheridge et al., 1998) Approx. Sea Level AD 1700-1850 • The intensity and duration of El Niño events increases • Traditionally thought of as the end of the Little Ice Age period • Both solar variability and atmospheric CO2 increase significantly From Mayewski et al., (2004)
H WARMING L COOLING El Niño data from Meyerson et al., (2002) Δ14C data from Stuiver and Braziunas, (1993) Maunder Minimum Spörer Minimum Wolf Minimum CO2 data from DSS ice core (Etheridge et al., 1998) Approx. Sea Level AD 1850-Present From Mayewski et al., (2004)
L WARMING H COOLING El Niño data from Meyerson et al., (2002) Δ14C data from Stuiver and Braziunas, (1993) Maunder Minimum Spörer Minimum Wolf Minimum CO2 data from DSS ice core (Etheridge et al., 1998) Approx. Sea Level AD 1850-Present • The intensity of long duration El Niño events stays high • Solar variability remains high • Atmospheric CO2 concentrations increase exponentially From Mayewski et al., (2004)
L Proxies Developed So Far…
L H H L WARMING COOLING WALKER CIRCULATION SEA ICE Proxies Developed So Far… ACCUMULATION
U.S.ITASE TRAVERSES DOME-A L H H L WARMING COOLING WALKER CIRCULATION SEA ICE ACCUMULATION
CONCLUSIONS • Strong link between West Antarctica and tropical Pacific • Since AD 1700 extra-tropical regions of the SH have experienced significant climate variability coincident with changes in both solar variability and greenhouse gas concentrations • Antarctic atmospheric circulation intensity is currently operating within the normal range of variability of the last ~700 years • Temperature at SD is currently above the natural range of variability of the last ~700 years (temp. at LD is within range) • ITASE proxy records corroborate and strengthen the longer proxies from deeper Antarctic ice cores