Download
1 / 63
630 likes | 711 Vues
Detailed analysis of TB prevalence, case notifications, drug resistance, and HIV co-infection trends in Asiam. Evaluate microscopy network parameters and plan for improved coverage. Address issues affecting smear-positivity rate.

E N D
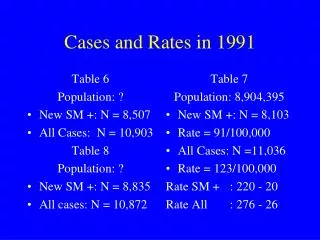
Table 6 Population: ? New SM +: N = 8,507 All Cases: N = 10,903 Table 8 Population: ? New SM +: N = 8,835 All cases: N = 10,872 Table 7 Population: 8,904,395 New SM +: N = 8,103 Rate = 91/100,000 All Cases: N =11,036 Rate = 123/100,000 Rate SM + : 220 - 20 Rate All : 276 - 26 Cases and Rates in 1991
Cases and Rates in 2009 • N SM +: N = 17,863 • Rate N SM + = 133/100,000 • All forms: N = 38,770 • Rate All forms: 289/100,000 • Source cases: Page 9 R10 proposal
NOTIFICATIONS ASIAM 1982-2008 ALL FORMS SMEAR POSITIVE (N+R)
NOTIFICATIONS/100,000 ASIAM 1982-2006 NOTIFICATIONS/100,000 ASIAM 1982-2008 ALL FORMS ALL FORMS SMEAR POSITIVE (N+R) SMEAR POSITIVE (N+R)
Average Prevalence 1981-1989 Table 5: • Survey population: N = 71,398 • Smear-positive cases: N = 374 • Prevalence smear-positive cases = 520/ 100,000 population Note: Table 4: ARI in 1970 between 4.7 and 2.7 !!
Prevalence in 2001 • SM+: 270/100,000 • Cult+: 902/100,000 • CDR SM +: 124/270 = 46% • Trend of prevalence: 520 (81-89) > 270 (01) True decline or unreliable survey data?
Conclusions The TB problem is still serious as: • Notification rate SM+ = 91/100,000 in 1991 (74% of all cases are new smear-positive) • Notification rate SM+ = 141/100,000 in 2000 • Prevalence rate of SM+ 81-89 = 520/100,000 • Prevalence rate of SM+ 2001 = 270/100,000 • HIV + TB: 2.5% in 95 > 8.9% in 2000 > 10.3 in 2001
Observations • Trend of notifications 82-91 is inconclusive • New SM+ notification rate in 1991< 20% of SM + prevalence rate (1981-1989) • Rate SM+ ranges from 220/100,000 in province 1 to 17/100,000 in province 17 • 20% of cases are registered in the capital • 36% of cases in the capital are > 54
Observations • Trend of notifications 92-2004 steady increase • DOTS introduced in 1994 • In 2004 ~ 50% of prevalent cases detected • Still considerable differences between provinces • TB problem increasing due to HIV
Final Conclusions • The TB problem in Asiam is serious • The NTP in Asiam detects only 50% of the prevalent cases • Case-detection in a number of provinces is very low • How to increase coverage and detection?
Problem description and Situational analysis • TB prevalence survey data • Tuberculin survey data: prevalence of infection with M.tuberculosis • Case notifications recent and past years • Age, Gender, Area differences • Rates and trend • Drug resistance survey data • HIV prevalence, incidence and trend
Conclude: • Size of TB problem: High, medium, low? High: > 50 new sm+ cases/100,000 per yr. Low: < 10 new sm+ cases/100,000 per yr. • Trend: Increase, decrease, stable? • Program coverage: % of districts? Estimate number of expected TB notifications for each year during plan period! (3 to 5years)
Block 5 • 8,507/38,868 = 22% (see table 6, set I) • 93/171 centers = 53% (see table 10, set I) • 38,868 x 3 = 116,604 : 260 = 448 : 93 = ~ 5 (4.8) • 9,000,000 : 100,000 = 90 x 520 = 46,800 x 35% = 16,380 x 30 = 491,400 : 260 = 1,890 : 93 = 20,3 Yes the number is sufficient
Block 5 • Positive suspects 33.6% (2002 review, 18) • 141 microscopy centers (2002 review, 14) • 15,640 : 33.6 x 100 = 46,548 x 3 = 139,642 : 260 = 537 : 141 = ~ 4 (3.8) • 12,014,000 : 100,000 x 270 = 32,438 x 70% = 22,706 x 30 = 681,194 : 260 = 2,620 : 141 = 18,6
suspects sputum positivity rate smear positive cases % population examined
sputum positivity rate proportion of population examined by direct microscopy
RESULTS OF DIRECT MICROSCOPY IN DISTRICT X FROM 1997 TILL 2001
PARAMETERS FOR PLANNING THE MICROSCOPY NETWORK • Expected number of smear-positive cases • As a rule one centre per 100,000 population if case-notification rate of smear + cases = 50/100,000 • 3 smears per suspect • Number of smears per technician per day: Not more than 20 • Minimum requirement one positive case per week per reader in view of proficiency
PARAMETERS FOR PLANNING THE MICROSCOPY NETWORK • Workload and smear-positivity rate (SPR): SPR 20% = 1 positive case per 5 suspects = 15 smears to diagnose one sm+ case SPR 5% = 1 positive case per 20 suspects = 60 smears to diagnose one sm+ case • Screening of suspects by X-ray? • Number of existing microscopy centres • Available technicians and available time for direct microscopy per centre
Conclude: • Number of microscopy centres sufficient or not? If not how many more needed? • Available technicians and time sufficient or not? If not train and employ more or ensure more time of available technicians • Calculate need for microscopes, slides, cups, reagents, slide boxes, laboratory equipment, immersion oil, etc.
External Factors Influencing Smear-Positivity Rate • Prevalence of Tuberculosis in community • Prevalence of other conditions causing a chronic cough • Patients delay/doctors delay • Selection of suspects • Active CF surveys Duration of cough as criteria Screening of suspects by X-ray
Laboratory Factors Influencing Smear-Positivity Rate False Positive Results Acid Fast Particles other than TB bacilli Food particles Precipitated stains (filter, use fresh stains) Saprophytic acid-fast bacilli (distilled water) Spores, fibers, pollen Scratches on slide (always use new slides) Contamination
Laboratory Factors Influencing Smear-Positivity Rate False Negative Results Inadequate sputum collection Selection of particles from sputum Inadequate storage of sputum specimens and stained smears Inadequate preparation of smears or staining of slides Inadequate examination of the smear
Laboratory Factors Influencing Smear-Positivity Rate False Negative Results Administrative errors Reading errors Time spend on reading Work load
Indicators to evaluate microscopyusing the laboratory register • % of population in the district examined per year by direct microscopy = suspects in the register (one year) -------------------------------------------- x 100 population of the district in that year • Value: 0.6 to 0.9 (Note:Vietnam data)
Indicators to evaluate microscopyusing the laboratory register • Distribution of positive smear results 80-85% of positive cases show positive in the first smear Few (~ 5%) positive cases show positive in the third smear only This distribution should normally appear in the laboratory register, if not this should be investigated
Indicators to evaluate microscopyusing the laboratory register • Smear-positivity rate: N suspects with positive smear result(s) during a quarter or year --------------------------------------- x 100 N suspects examined during a quarter or year • Value usually observed: 5 to 15%
Indicators to evaluate microscopyusing the laboratory register • % of suspects with three smear results • N suspects with 3 smear • result(s) during a quarter or year • --------------------------------------- x 100 • N suspects examined during • a quarter or year • Value: Target 100%. • Observed in good programs 85-90%
Further use of laboratory register • Calculation of proportions of suspects by Gender Age-groups Distance to microscopy centre • Time between first examination and diagnosis • Number of examinations per day/ month • Requirements of slides and materials
Link with TB register • Serial number of laboratory book in TB register and TB registration number in laboratory register • Are all diagnosed SM + cases (new and previously treated) put on treatment? • Average time between diagnosis and start of treatment • % of negative suspects put on treatment
Case of tuberculosis • A definite case of TB, or one in which a clinician has diagnosed TB and has decided to treat the patient with a full course of TB treatment • Note: Any person given treatment for tuberculosis should be recorded
A definite case of tuberculosis • Patient with positive culture or positive LPA test for the Mycobacterium tuberculosis complex • In countries where culture is not routinely available a patient with one or more initial sputum smears positive for acid fast bacilli (AFB+) is also considered a definite case
Smear positive pulmonary case • At least one initial sputum smear examination (direct smear microscopy) with at least one AFB provided that there is a functional EQA system with blind rechecking
STAG 2007 New definition of smear-positive PTB One smear with at least one AFB in 100 fields
Smear-negative pulmonary case Sputum smear-negative, but culture positive At least 2 sputum specimens at the start of treatment with functional EQA, high workload and limited human resources Sputum culture should be performed in settings where HIV > 1% in pregnant women or > 5% in TB patients
Smear-negative PTB case (B) Decision by a clinician to treat with a full course of anti-TB therapy X-ray suggestive for active TB and patient is HIV+ (laboratory or clinical evidence) X-ray suggestive for active TB and no improvement after antibiotics in HIV-negative patients
STAG 2007 New definition of smear-negative PTB When two smears are negative follow algorithm for the diagnosis of smear-negative tuberculosis
Extra-pulmonary case • Patient with tuberculosis of organs other than the lungs e.g. pleura, lymph nodes, abdomen, genito-urinary tract, skin, joint and bones, meninges • Note: a patient diagnosed with both pulmonary and extra-pulmonary tuberculosis should be classified as a case of pulmonary tuberculosis
EPTB • Diagnosis of EPTB should be based on one culture positive specimen, or histological or strong clinical evidence consistent with active extra-pulmonary disease, followed by a decision by a clinician to treat with a full course of anti-tuberculosis chemotherapy
New Case • Patient who has never had treatment for tuberculosis, or who has taken anti-tuberculosis drugs for less than one month
Previously treated case • Received 1 month or more anti-TB drugs • May be smear-positive or –negative • May have TB at any site • Further defined by treatment outcome: • Relapse, Failure and Default • Note: classification “Chronic” stopped
Indicators for quality of Diagnosis • Proportions of New SM +, SM - and EPTB depend on efficiency of CF and diagnostic methods used • Proportions reported by well organised NTP’s are: 60-70% New smear-positive PTB 20-30% New smear-negative PTB 10-20% New EPTB
Indicators for quality of Diagnosis • Ratio New SM +/New SM- PTB N new smear-positive TB cases --------------------------------------- N new smear-negative TB cases • Value: normally 2 to 2.5, but often lower in high HIV prevalence countries • Minimum acceptable level 1 to 1.5
Indicators for quality of Diagnosis • In high HIV-prevalence countries the proportion of EPTB may be higher due to a higher frequency of Pleural Effusions and miliary TB • Diagnosis of EPTB depends further on clinical capacity, preferences of clinicians and focus on childhood TB
Indicators for quality of Diagnosis • A SM+/SM- PTB ratio of <1 may indicate that SM- cases are diagnosed without microscopy (X-ray and clinical diagnosis) • The proportion of relapses: should be < 5-7% of all cases reported or less than <10% of new smear-positive cases reported • A high proportion of previously treated cases is an indication of poor program and/or poor private sector performance
Block 8: Strategies for DOT • Population 2000: 12,014,000 (table 3. set II) • Cases detected: 18,892 (table 3. set II) • HC’s: 90% x 632 = 569 (table 7. set II) • Area Asiam: 181,035 sq.km. (table 1. Set II) • Area 5 km radius = 3.14 (π) x 5 km² = 78,5 x 569 = 44,667 : 181,035 x 100 = 25% (30% if 115 hospitals also provide A-Dots) • Beds: 18,892 x 75% = 14,169 : 6 = 2,362 • (19 to 21 beds per hospital: 2,362 : 115)
Advantages of SCC • Lower case-fatality (high sterilising effect) • Lower relapse rate (role of pyrazinamide) • Lower default rate (shorter duration) • Intermittent (3 x per week or on alternating days) as effective as daily treatment • Effective in HIV+ TB cases (only daily!) • DOT is essential to prevent R resistance