Pin : Building Customized Program Analysis Tools with Dynamic Instrumentation
200 likes | 302 Vues
Pin is a dynamic binary instrumentation system designed for transparent, efficient, and architecture-independent program analysis. It provides a rich API for writing pintools, supports instrumentation at multiple levels, and offers optimized instrumentation techniques. Pin enables instrumentation customization without requiring in-depth architecture knowledge.

Pin : Building Customized Program Analysis Tools with Dynamic Instrumentation
E N D
Presentation Transcript
Pin : Building Customized Program Analysis Tools with Dynamic Instrumentation Chi-Keung Luk, Robert Cohn, Robert Muth, Harish Patil, Artur Klauser, Geoff Lowney, Steven Wallace, Vijay Janapa Reddi, Kim Hazelwood
What is Pin ? • Dynamic binary instrumentation system. • JIT compiler. • Pintools for writing instrumentation routines. • Rich API for pintools. • Call-based model of instrumentation.
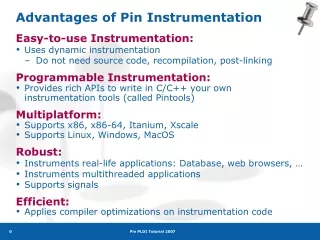
Design goals • Transparency • Application observes same addresses (code/data) and values (register/memory). • Ease-of-use • Architecture knowledge not required. • Manual inlining of instrumentation instructions not required. • Manual save/restore of architectural state not required. • Portability • Architecture independent API for pintools. • Efficiency • Optimized instrumentation. • Robustness • Handle binaries with mixed code and data. • Handle variable length instructions. • Process attaching/detaching • Support instrumentation at instruction/basic block/routine levels.
Instrumentation with Pin • Attach to process using ptrace. • Intercept execution of first/next instruction. • Loop until process terminate or detach from process • Generate new code(trace) for straight-line code sequence starting from instruction. • Insert calls to instrumentation routines into jitted trace. • Trace stored in code cache and executed. • Branche(s) in trace transfer control back to Pin. • Repeat starting with branch target instruction.
Trace code management • Software based cache:<entryIaddr, entrySct> • entryIaddr : original instruction address of trace entry. • entrySct: static context of trace. • Register bindings. • Recent call sites (call stack). • Two traces are compatible if they have same entryIaddr and same entrySct or only register binding differences. • JIT generates new trace only if no compatible trace exists in code cache. • Hash table:<entryIaddr> • Trace entry address. • Trace entry liveness information.
Support for multithreaded applications • Thread local storage for virtual register spilling. • Pin steals physical register(%ebx,%r7) as pointer to spill area. • Application is assumed to be single threaded until thread-create syscall is intercepted. • Spill area accessed using absolute addressing for single threaded application.
Optimized Instrumentation • Trace linking • Register re-allocation • Inlining • X86 eflags liveness analysis • Instruction scheduling
Trace Linking • Branch directly from trace exit to target trace. • Trivial for direct branches but difficult for indirect branches. • Optimization techniques • Target prediction. • Per indirect jump hashtable. • Function cloning for returns using call stack.
Register re-allocation • Obtain registers for JIT without overwriting application’s scratch registers. • Interprocedural register allocation. • Register liveness analysis. • Reconciliation of register bindings.
Other instrumentation optimizations • Inline analysis routines • Avoid call/return to/from bridge routine. • Avoid call/return to/from analysis routine. • Rename caller-save registers, avoid explicit save/restore. • x86 eflags liveness analysis • Avoid save/restore of dead eflags. • Pintool API (IPOINT_ANYWHERE) • Schedule analysis routine to avoid save/restore of eflags.
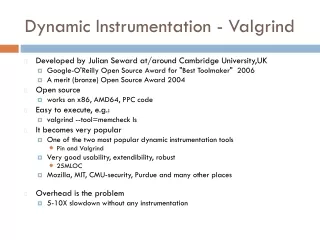
Experimental Evaluation • IA32, EM64T, Itanium, and ARM ports. • Instrumentation optimizations. • Comparison with Valgrind and DynamoRIO. • Performance without instrumentation. • Performance with basic block counting instrumentation.
Sample Pintools • Opcodemix. • Determine dynamic mix of opcode of execution. • Useful for architectural and compiler comparison studies. • PinPoints. • Automated collection and validation of representative instruction traces.