Download
1 / 81
830 likes | 1.03k Vues
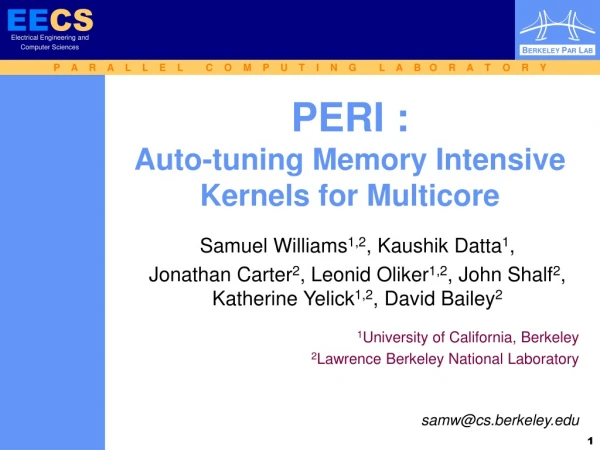
Auto-tuning Performance on Multicore Computers. Auto-tuning Performance on Multicore Computers. Samuel Williams David Patterson, advisor and chair Kathy Yelick Sara McMains Ph.D. Dissertation Talk samw@cs.berkeley.edu. Multicore Processors. Multicore Processors. Superscalar Era.

E N D
Auto-tuning Performance on Multicore Computers Auto-tuning Performance on Multicore Computers Samuel Williams David Patterson, advisor and chair Kathy Yelick Sara McMains Ph.D. Dissertation Talk samw@cs.berkeley.edu
Multicore Processors Multicore Processors
Superscalar Era 0% / year ~12% / year Multicore is the agreed solution ~25% / year 7% / year • Single thread performance scaled at 50% per year • Bandwidth increases much more slowly, but we could add additional bits or channels. • Lack of diversity in architecture = lack of individual tuning • Power wall has capped single thread performance Processor Memory Latency Memory Bandwidth Log(Performance) ~50% / year 1990 1995 2000 2005
Superscalar Era But, no agreement on what it should look like • Single thread performance scaled at 50% per year • Bandwidth increases much more slowly, but we could add additional bits or channels. • Lack of diversity in architecture = lack of individual tuning • Power wall has capped single thread performance Processor Memory 0% / year Log(Performance) ~12% / year ~50% / year ~25% / year 1990 1995 2000 2005
Multicore Era +25% / year (parallel) ~12% / year • Take existing power limited superscalar processors, and add cores. • Serial code shows no improvement • Parallel performance might improve at 25% per year. = improvement in power efficiency from process tech. • DRAM bandwidth is currently only improving by ~12% per year. • Intel / AMD model. Log(Performance) +0% / year (serial) 2003 2005 2007 2009
Multicore Era +40% / year (parallel) +12% / year +0% / year (serial) • Radically different approach • Give up superscalar OOO cores in favor of small, efficient, in-order cores • Huge, abrupt, shocking drop in single thread performance • May eliminate power wall, allowing many cores, and performance to scale at up to 40% per year • Troubling, the number of DRAM channels many need to double every three years • Niagara, Cell, GPUs Log(Performance) 2003 2005 2007 2009
Multicore Era +40% / year (parallel) +12% / year -12% / year (serial) • Another option would be to reduce per core performance (and power) every year • Graceful degradation in serial performance • Bandwidth is still an issue Log(Performance) 2003 2005 2007 2009
Multicore Era • There are still many other architectural knobs • Superscalar? Dual issue? VLIW ? • Pipeline depth • SIMD width ? • Multithreading (vertical, simultaneous)? • Shared caches vs. Private Caches ? • FMA vs. MUL+ADD vs. MUL or ADD • Clustering of cores • Crossbars vs. Rings vs. Meshes • Currently, no consensus on optimal configuration • As a result, there is a plethora of multicore architectures
Computational Motifs Computational Motifs
Computational Motifs • Evolved from the Phil Colella’s Seven Dwarfs of Parallel Computing • Numerical Methods common throughout scientific computing • Dense and Sparse Linear Algebra • Computations on Structured and Unstructured Grids • Spectral Methods • N-Body Particle Methods • Monte Carlo • Within each dwarf, there are a number of computational kernels • The Berkeley View, and subsequently Par Lab expanded these to many other domains in computing (embedded, SPEC, DB, Games) • Graph Algorithms • Combinational Logic • Finite State Machines • etc… • rechristened Computational Motifs • Each could be black-boxed into libraries or frameworks by domain experts. • But how do we get good performance given the diversity of architecture?
Auto-tuning Auto-tuning
Auto-tuning(motivation) • Given a huge diversity of processor architectures, an code hand-optimized for one architecture will likely deliver poor performance on another. Moreover, code optimized for one input data set may deliver poor performance on another. • We want a single code base that delivers performance portability across the breadth of architectures today and into the future. • Auto-tuners are composed of two principal components: • A code generator based on high-level functionality rather than parsing C • And the auto-tuner proper that searches for the optimal parameters for each optimization. • Auto-tuner’s don’t invent or discover optimizations, they search through the parameter space for a variety of known optimizations. • Proven value in Dense Linear Algebra(ATLAS), Spectral(FFTW,SPIRAL), and Sparse Methods(OSKI)
Auto-tuning(code generation) • The code generator produces many code variants for some numerical kernel using known optimizations and transformations. • For example, • cache blocking adds several parameterized loop nests. • Prefetching adds parameterized intrinsics to the code • Loop unrolling and reordering explicitly unrolls the code. Each unrolling is a unique code variant. • Kernels can have dozens of different optimizations, some of which can produce hundreds of code variants. • The code generators used in this work are kernel-specific, and were written in Perl.
Auto-tuning(search) • In this work, we use two search techniques: • Exhaustive - examine every combination of parameter for every optimization. (often intractable) • Heuristics - use knowledge of architecture or algorithm to restrict the search space. Parameter Space for Optimization B Parameter Space for Optimization B Parameter Space for Optimization A Parameter Space for Optimization A
Auto-tuning Performance on Multicore Computers Auto-tuning Performance on Multicore Computers Overview Multicore SMPs The Roofline Model Auto-tuning LBMHD Auto-tuning SpMV Summary Future Work
Thesis Contributions • Introduced the Roofline Model • Extended auto-tuning to the structured grid motif (specifically LBMHD) • Extended auto-tuning to multicore • Fundamentally different from running auto-tuned serial code on multicore SMPs. • Apply the concept to LBMHD and SpMV. • Analyzed the breadth of multicore architectures in the context of auto-tuned SpMV and LBMHD • Discussed future directions in auto-tuning
Multicore SMPs Multicore SMPs Chapter 3 Overview Multicore SMPs The Roofline Model Auto-tuning LBMHD Auto-tuning SpMV Summary Future Work
Multicore SMP Systems_ Core Core Core Core Core Core Core Core 4MB L2 4MB L2 4MB L2 4MB L2 Opteron Opteron Opteron Opteron Opteron Opteron Opteron Opteron 4GB/s (each direction) HyperTransport HyperTransport 512K 512K 512K 512K 512K 512K 512K 512K FSB FSB 10.66 GB/s 10.66 GB/s 2MB victim 2MB victim MCH (4x64b controllers) SRI / xbar SRI / xbar 21.33 GB/s(read) 10.66 GB/s(write) 2x64b controllers 2x64b controllers 667MHz FBDIMMs 10.6 GB/s 10.6 GB/s 667MHz DDR2 DIMMs 667MHz DDR2 DIMMs VMT PPE VMT PPE SPE SPE SPE SPE SPE SPE SPE SPE SPE SPE SPE SPE SPE SPE SPE SPE MT SPARC MT SPARC MT SPARC MT SPARC MT SPARC MT SPARC MT SPARC MT SPARC MT SPARC MT SPARC MT SPARC MT SPARC MT SPARC MT SPARC MT SPARC MT SPARC 512K L2 512K L2 BIF BIF <20GB/s (each direction) 256K 256K 256K 256K 256K 256K 256K 256K 256K 256K 256K 256K 256K 256K 256K 256K Crossbar Crossbar 8 x 6.4 GB/s (1 per hub per direction) 179 GB/s 179 GB/s 90 GB/s 90 GB/s MFC MFC MFC MFC MFC MFC MFC MFC MFC MFC MFC MFC MFC MFC MFC MFC EIB (ring network) EIB (ring network) 4MB Shared L2 (16 way) (64b interleaved) 4MB Shared L2 (16 way) (64b interleaved) XDR memory controllers XDR memory controllers 4 Coherency Hubs 4 Coherency Hubs 25.6 GB/s 25.6 GB/s 2x128b controllers 2x128b controllers 512MB XDR DRAM 512MB XDR DRAM 21.33 GB/s 21.33 GB/s 10.66 GB/s 10.66 GB/s 667MHz FBDIMMs 667MHz FBDIMMs Intel Xeon E5345 (Clovertown) AMD Opteron 2356 (Barcelona) Sun UltraSPARC T2+ T5140 (Victoria Falls) IBM QS20 (Cell Blade)
Multicore SMP Systems(Conventional cache-based memory hierarchy) Core Core Core Core Core Core Core Core 4MB L2 4MB L2 4MB L2 4MB L2 Opteron Opteron Opteron Opteron Opteron Opteron Opteron Opteron 4GB/s (each direction) HyperTransport HyperTransport 512K 512K 512K 512K 512K 512K 512K 512K FSB FSB 10.66 GB/s 10.66 GB/s 2MB victim 2MB victim MCH (4x64b controllers) SRI / xbar SRI / xbar 21.33 GB/s(read) 10.66 GB/s(write) 2x64b controllers 2x64b controllers 667MHz FBDIMMs 10.6 GB/s 10.6 GB/s 667MHz DDR2 DIMMs 667MHz DDR2 DIMMs MT SPARC MT SPARC MT SPARC MT SPARC MT SPARC MT SPARC MT SPARC MT SPARC MT SPARC MT SPARC MT SPARC MT SPARC MT SPARC MT SPARC MT SPARC MT SPARC Crossbar Crossbar 8 x 6.4 GB/s (1 per hub per direction) 179 GB/s 179 GB/s 90 GB/s 90 GB/s 4MB Shared L2 (16 way) (64b interleaved) 4MB Shared L2 (16 way) (64b interleaved) 4 Coherency Hubs 4 Coherency Hubs 2x128b controllers 2x128b controllers 21.33 GB/s 21.33 GB/s 10.66 GB/s 10.66 GB/s 667MHz FBDIMMs 667MHz FBDIMMs Intel Xeon E5345 (Clovertown) AMD Opteron 2356 (Barcelona) Sun UltraSPARC T2+ T5140 (Victoria Falls) IBM QS20 (Cell Blade) VMT PPE VMT PPE SPE SPE SPE SPE SPE SPE SPE SPE SPE SPE SPE SPE SPE SPE SPE SPE 256K 256K 256K 256K 256K 256K 256K 256K 256K 256K 256K 256K 256K 256K 256K 256K 512K L2 512K L2 BIF BIF <20GB/s (each direction) MFC MFC MFC MFC MFC MFC MFC MFC MFC MFC MFC MFC MFC MFC MFC MFC EIB (ring network) EIB (ring network) XDR memory controllers XDR memory controllers 25.6 GB/s 25.6 GB/s 512MB XDR DRAM 512MB XDR DRAM
Multicore SMP Systems(local store-based memory hierarchy) Core Core Core Core Core Core Core Core 4MB L2 4MB L2 4MB L2 4MB L2 Opteron Opteron Opteron Opteron Opteron Opteron Opteron Opteron 4GB/s (each direction) HyperTransport HyperTransport 512K 512K 512K 512K 512K 512K 512K 512K FSB FSB 10.66 GB/s 10.66 GB/s 2MB victim 2MB victim MCH (4x64b controllers) SRI / xbar SRI / xbar 21.33 GB/s(read) 10.66 GB/s(write) 2x64b controllers 2x64b controllers 667MHz FBDIMMs 10.6 GB/s 10.6 GB/s 667MHz DDR2 DIMMs 667MHz DDR2 DIMMs IBM QS20 (Cell Blade) VMT PPE VMT PPE SPE SPE SPE SPE SPE SPE SPE SPE SPE SPE SPE SPE SPE SPE SPE SPE MT SPARC MT SPARC MT SPARC MT SPARC MT SPARC MT SPARC MT SPARC MT SPARC MT SPARC MT SPARC MT SPARC MT SPARC MT SPARC MT SPARC MT SPARC MT SPARC 256K 256K 256K 256K 256K 256K 256K 256K 256K 256K 256K 256K 256K 256K 256K 256K 512K L2 512K L2 BIF BIF Crossbar Crossbar <20GB/s (each direction) 8 x 6.4 GB/s (1 per hub per direction) 179 GB/s 179 GB/s 90 GB/s 90 GB/s MFC MFC MFC MFC MFC MFC MFC MFC MFC MFC MFC MFC MFC MFC MFC MFC 4MB Shared L2 (16 way) (64b interleaved) 4MB Shared L2 (16 way) (64b interleaved) EIB (ring network) EIB (ring network) 4 Coherency Hubs 4 Coherency Hubs XDR memory controllers XDR memory controllers 2x128b controllers 2x128b controllers 25.6 GB/s 25.6 GB/s 21.33 GB/s 21.33 GB/s 10.66 GB/s 10.66 GB/s 512MB XDR DRAM 512MB XDR DRAM 667MHz FBDIMMs 667MHz FBDIMMs Intel Xeon E5345 (Clovertown) AMD Opteron 2356 (Barcelona) Sun UltraSPARC T2+ T5140 (Victoria Falls)
Multicore SMP Systems(CMT = Chip Multithreading) Core Core Core Core Core Core Core Core 4MB L2 4MB L2 4MB L2 4MB L2 Opteron Opteron Opteron Opteron Opteron Opteron Opteron Opteron 4GB/s (each direction) HyperTransport HyperTransport 512K 512K 512K 512K 512K 512K 512K 512K FSB FSB 10.66 GB/s 10.66 GB/s 2MB victim 2MB victim MCH (4x64b controllers) SRI / xbar SRI / xbar 21.33 GB/s(read) 10.66 GB/s(write) 2x64b controllers 2x64b controllers 667MHz FBDIMMs 10.6 GB/s 10.6 GB/s 667MHz DDR2 DIMMs 667MHz DDR2 DIMMs MT SPARC MT SPARC MT SPARC MT SPARC MT SPARC MT SPARC MT SPARC MT SPARC MT SPARC MT SPARC MT SPARC MT SPARC MT SPARC MT SPARC MT SPARC MT SPARC Crossbar Crossbar 8 x 6.4 GB/s (1 per hub per direction) 179 GB/s 179 GB/s 90 GB/s 90 GB/s 4MB Shared L2 (16 way) (64b interleaved) 4MB Shared L2 (16 way) (64b interleaved) 4 Coherency Hubs 4 Coherency Hubs 2x128b controllers 2x128b controllers 21.33 GB/s 21.33 GB/s 10.66 GB/s 10.66 GB/s 667MHz FBDIMMs 667MHz FBDIMMs Intel Xeon E5345 (Clovertown) AMD Opteron 2356 (Barcelona) Sun UltraSPARC T2+ T5140 (Victoria Falls) IBM QS20 (Cell Blade) VMT PPE VMT PPE SPE SPE SPE SPE SPE SPE SPE SPE SPE SPE SPE SPE SPE SPE SPE SPE 256K 256K 256K 256K 256K 256K 256K 256K 256K 256K 256K 256K 256K 256K 256K 256K 512K L2 512K L2 BIF BIF <20GB/s (each direction) MFC MFC MFC MFC MFC MFC MFC MFC MFC MFC MFC MFC MFC MFC MFC MFC EIB (ring network) EIB (ring network) XDR memory controllers XDR memory controllers 25.6 GB/s 25.6 GB/s 512MB XDR DRAM 512MB XDR DRAM
Multicore SMP Systems(peak double-precision FLOP rates) Core Core Core Core Core Core Core Core 4MB L2 4MB L2 4MB L2 4MB L2 Opteron Opteron Opteron Opteron Opteron Opteron Opteron Opteron 4GB/s (each direction) HyperTransport HyperTransport 512K 512K 512K 512K 512K 512K 512K 512K FSB FSB 10.66 GB/s 10.66 GB/s 2MB victim 2MB victim MCH (4x64b controllers) SRI / xbar SRI / xbar 21.33 GB/s(read) 10.66 GB/s(write) 2x64b controllers 2x64b controllers 667MHz FBDIMMs 10.6 GB/s 10.6 GB/s 667MHz DDR2 DIMMs 667MHz DDR2 DIMMs VMT PPE VMT PPE SPE SPE SPE SPE SPE SPE SPE SPE SPE SPE SPE SPE SPE SPE SPE SPE MT SPARC MT SPARC MT SPARC MT SPARC MT SPARC MT SPARC MT SPARC MT SPARC MT SPARC MT SPARC MT SPARC MT SPARC MT SPARC MT SPARC MT SPARC MT SPARC 512K L2 512K L2 BIF BIF <20GB/s (each direction) 256K 256K 256K 256K 256K 256K 256K 256K 256K 256K 256K 256K 256K 256K 256K 256K Crossbar Crossbar 8 x 6.4 GB/s (1 per hub per direction) 179 GB/s 179 GB/s 90 GB/s 90 GB/s MFC MFC MFC MFC MFC MFC MFC MFC MFC MFC MFC MFC MFC MFC MFC MFC EIB (ring network) EIB (ring network) 4MB Shared L2 (16 way) (64b interleaved) 4MB Shared L2 (16 way) (64b interleaved) XDR memory controllers XDR memory controllers 4 Coherency Hubs 4 Coherency Hubs 25.6 GB/s 25.6 GB/s 2x128b controllers 2x128b controllers 512MB XDR DRAM 512MB XDR DRAM 21.33 GB/s 21.33 GB/s 10.66 GB/s 10.66 GB/s 667MHz FBDIMMs 667MHz FBDIMMs Intel Xeon E5345 (Clovertown) AMD Opteron 2356 (Barcelona) 74.66 GFLOP/s 73.60 GFLOP/s Sun UltraSPARC T2+ T5140 (Victoria Falls) IBM QS20 (Cell Blade) 18.66 GFLOP/s 29.25 GFLOP/s
Multicore SMP Systems(DRAM pin bandwidth) Core Core Core Core Core Core Core Core 4MB L2 4MB L2 4MB L2 4MB L2 Opteron Opteron Opteron Opteron Opteron Opteron Opteron Opteron 4GB/s (each direction) HyperTransport HyperTransport 512K 512K 512K 512K 512K 512K 512K 512K FSB FSB 10.66 GB/s 10.66 GB/s 2MB victim 2MB victim MCH (4x64b controllers) SRI / xbar SRI / xbar 21.33 GB/s(read) 10.66 GB/s(write) 2x64b controllers 2x64b controllers 667MHz FBDIMMs 10.6 GB/s 10.6 GB/s 667MHz DDR2 DIMMs 667MHz DDR2 DIMMs VMT PPE VMT PPE SPE SPE SPE SPE SPE SPE SPE SPE SPE SPE SPE SPE SPE SPE SPE SPE MT SPARC MT SPARC MT SPARC MT SPARC MT SPARC MT SPARC MT SPARC MT SPARC MT SPARC MT SPARC MT SPARC MT SPARC MT SPARC MT SPARC MT SPARC MT SPARC 512K L2 512K L2 BIF BIF <20GB/s (each direction) 256K 256K 256K 256K 256K 256K 256K 256K 256K 256K 256K 256K 256K 256K 256K 256K Crossbar Crossbar 8 x 6.4 GB/s (1 per hub per direction) 179 GB/s 179 GB/s 90 GB/s 90 GB/s MFC MFC MFC MFC MFC MFC MFC MFC MFC MFC MFC MFC MFC MFC MFC MFC EIB (ring network) EIB (ring network) 4MB Shared L2 (16 way) (64b interleaved) 4MB Shared L2 (16 way) (64b interleaved) XDR memory controllers XDR memory controllers 4 Coherency Hubs 4 Coherency Hubs 25.6 GB/s 25.6 GB/s 2x128b controllers 2x128b controllers 512MB XDR DRAM 512MB XDR DRAM 21.33 GB/s 21.33 GB/s 10.66 GB/s 10.66 GB/s 667MHz FBDIMMs 667MHz FBDIMMs Intel Xeon E5345 (Clovertown) AMD Opteron 2356 (Barcelona) 21 GB/s(read) 10 GB/s(write) 21 GB/s Sun UltraSPARC T2+ T5140 (Victoria Falls) IBM QS20 (Cell Blade) 42 GB/s(read) 21 GB/s(write) 51 GB/s
Multicore SMP Systems(Non-Uniform Memory Access) Core Core Core Core Core Core Core Core 4MB L2 4MB L2 4MB L2 4MB L2 Opteron Opteron Opteron Opteron Opteron Opteron Opteron Opteron 4GB/s (each direction) HyperTransport HyperTransport 512K 512K 512K 512K 512K 512K 512K 512K FSB FSB 10.66 GB/s 10.66 GB/s 2MB victim 2MB victim MCH (4x64b controllers) SRI / xbar SRI / xbar 21.33 GB/s(read) 10.66 GB/s(write) 2x64b controllers 2x64b controllers 667MHz FBDIMMs 10.6 GB/s 10.6 GB/s 667MHz DDR2 DIMMs 667MHz DDR2 DIMMs VMT PPE VMT PPE SPE SPE SPE SPE SPE SPE SPE SPE SPE SPE SPE SPE SPE SPE SPE SPE MT SPARC MT SPARC MT SPARC MT SPARC MT SPARC MT SPARC MT SPARC MT SPARC MT SPARC MT SPARC MT SPARC MT SPARC MT SPARC MT SPARC MT SPARC MT SPARC 512K L2 512K L2 BIF BIF <20GB/s (each direction) 256K 256K 256K 256K 256K 256K 256K 256K 256K 256K 256K 256K 256K 256K 256K 256K Crossbar Crossbar 8 x 6.4 GB/s (1 per hub per direction) 179 GB/s 179 GB/s 90 GB/s 90 GB/s MFC MFC MFC MFC MFC MFC MFC MFC MFC MFC MFC MFC MFC MFC MFC MFC EIB (ring network) EIB (ring network) 4MB Shared L2 (16 way) (64b interleaved) 4MB Shared L2 (16 way) (64b interleaved) XDR memory controllers XDR memory controllers 4 Coherency Hubs 4 Coherency Hubs 25.6 GB/s 25.6 GB/s 2x128b controllers 2x128b controllers 512MB XDR DRAM 512MB XDR DRAM 21.33 GB/s 21.33 GB/s 10.66 GB/s 10.66 GB/s 667MHz FBDIMMs 667MHz FBDIMMs Intel Xeon E5345 (Clovertown) AMD Opteron 2356 (Barcelona) Sun UltraSPARC T2+ T5140 (Victoria Falls) IBM QS20 (Cell Blade)
Roofline Model Roofline Model Chapter 4 Overview Multicore SMPs The Roofline Model Auto-tuning LBMHD Auto-tuning SpMV Summary Future Work
Memory Traffic • Total bytes to/from DRAM • Can categorize into: • Compulsory misses • Capacity misses • Conflict misses • Write allocations • … • Oblivious of lack of sub-cache line spatial locality
Arithmetic Intensity O( N ) O( 1 ) O( log(N) ) A r i t h m e t i c I n t e n s i t y FFTs SpMV, BLAS1,2 Dense Linear Algebra (BLAS3) Stencils (PDEs) Particle Methods Lattice Methods • For purposes of this talk, we’ll deal with floating-point kernels • Arithmetic Intensity ~ Total FLOPs / Total DRAM Bytes • Includes cache effects • Many interesting problems have constant AI (w.r.t. problem size) • Bad given slowly increasing DRAM bandwidth • Bandwidth and Traffic are key optimizations
Basic Idea Attainable Performanceij = min FLOP/s with Optimizations1-i AI * Bandwidth with Optimizations1-j • Synthesize communication, computation, and locality into a single visually-intuitive performance figure using bound and bottleneck analysis. • Given a kernel’s arithmetic intensity (based on DRAM traffic after being filtered by the cache), programmers can inspect the figure, and bound performance. • Moreover, provides insights as to which optimizations will potentially be beneficial.
Constructing a Roofline Model (computational ceilings) 256.0 128.0 64.0 32.0 16.0 8.0 4.0 2.0 1.0 0.5 1/8 1/4 1/2 1 2 4 8 16 • Plot on log-log scale • Given AI, we can easily bound performance • But architectures are much more complicated • We will bound performance as we eliminate specific forms of in-core parallelism Opteron 2356 (Barcelona) peak DP attainable GFLOP/s Stream Bandwidth actual FLOP:Byte ratio
Constructing a Roofline Model (computational ceilings) 256.0 128.0 64.0 32.0 16.0 8.0 4.0 2.0 1.0 0.5 1/8 1/4 1/2 1 2 4 8 16 • Opterons have dedicated multipliers and adders. • If the code is dominated by adds, then attainable performance is half of peak. • We call these Ceilings • They act like constraints on performance Opteron 2356 (Barcelona) peak DP mul / add imbalance attainable GFLOP/s Stream Bandwidth actual FLOP:Byte ratio
Constructing a Roofline Model(computational ceilings) 256.0 128.0 64.0 32.0 16.0 8.0 4.0 2.0 1.0 0.5 1/8 1/4 1/2 1 2 4 8 16 • Opterons have 128-bit datapaths. • If instructions aren’t SIMDized, attainable performance will be halved Opteron 2356 (Barcelona) peak DP mul / add imbalance attainable GFLOP/s w/out SIMD Stream Bandwidth actual FLOP:Byte ratio
Constructing a Roofline Model (computational ceilings) 256.0 128.0 64.0 32.0 16.0 8.0 4.0 2.0 1.0 0.5 1/8 1/4 1/2 1 2 4 8 16 • On Opterons, floating-point instructions have a 4 cycle latency. • If we don’t express 4-way ILP, performance will drop by as much as 4x Opteron 2356 (Barcelona) peak DP mul / add imbalance attainable GFLOP/s w/out SIMD Stream Bandwidth w/out ILP actual FLOP:Byte ratio
Constructing a Roofline Model (communication ceilings) 256.0 128.0 64.0 32.0 16.0 8.0 4.0 2.0 1.0 0.5 1/8 1/4 1/2 1 2 4 8 16 • We can perform a similar exercise taking away parallelism from the memory subsystem Opteron 2356 (Barcelona) peak DP attainable GFLOP/s Stream Bandwidth actual FLOP:Byte ratio
Constructing a Roofline Model (communication ceilings) 256.0 128.0 64.0 32.0 16.0 8.0 4.0 2.0 1.0 0.5 1/8 1/4 1/2 1 2 4 8 16 • Explicit software prefetch instructions are required to achieve peak bandwidth Opteron 2356 (Barcelona) peak DP attainable GFLOP/s Stream Bandwidth w/out SW prefetch actual FLOP:Byte ratio
Constructing a Roofline Model(communication ceilings) 256.0 128.0 64.0 32.0 16.0 8.0 4.0 2.0 1.0 0.5 1/8 1/4 1/2 1 2 4 8 16 • Opterons are NUMA • As such memory traffic must be correctly balanced among the two sockets to achieve good Stream bandwidth. • We could continue this by examining strided or random memory access patterns Opteron 2356 (Barcelona) peak DP attainable GFLOP/s Stream Bandwidth w/out SW prefetch w/out NUMA actual FLOP:Byte ratio
Constructing a Roofline Model (computation + communication) 256.0 128.0 64.0 32.0 16.0 8.0 4.0 2.0 1.0 0.5 1/8 1/4 1/2 1 2 4 8 16 • We may bound performance based on the combination of expressed in-core parallelism and attained bandwidth. Opteron 2356 (Barcelona) peak DP mul / add imbalance attainable GFLOP/s w/out SIMD Stream Bandwidth w/out SW prefetch w/out NUMA w/out ILP actual FLOP:Byte ratio
Constructing a Roofline Model (locality walls) 256.0 128.0 64.0 32.0 16.0 8.0 4.0 2.0 1.0 0.5 1/8 1/4 1/2 1 2 4 8 16 • Remember, memory traffic includes more than just compulsory misses. • As such, actual arithmetic intensity may be substantially lower. • Walls are unique to the architecture-kernel combination Opteron 2356 (Barcelona) peak DP mul / add imbalance attainable GFLOP/s w/out SIMD Stream Bandwidth w/out SW prefetch w/out NUMA only compulsory miss traffic w/out ILP FLOPs AI = Compulsory Misses actual FLOP:Byte ratio
Constructing a Roofline Model (locality walls) 256.0 128.0 64.0 32.0 16.0 8.0 4.0 2.0 1.0 0.5 1/8 1/4 1/2 1 2 4 8 16 • Remember, memory traffic includes more than just compulsory misses. • As such, actual arithmetic intensity may be substantially lower. • Walls are unique to the architecture-kernel combination Opteron 2356 (Barcelona) peak DP mul / add imbalance attainable GFLOP/s w/out SIMD Stream Bandwidth w/out SW prefetch w/out NUMA +write allocation traffic only compulsory miss traffic w/out ILP FLOPs AI = Allocations + Compulsory Misses actual FLOP:Byte ratio
Constructing a Roofline Model (locality walls) 256.0 128.0 64.0 32.0 16.0 8.0 4.0 2.0 1.0 0.5 1/8 1/4 1/2 1 2 4 8 16 • Remember, memory traffic includes more than just compulsory misses. • As such, actual arithmetic intensity may be substantially lower. • Walls are unique to the architecture-kernel combination Opteron 2356 (Barcelona) peak DP mul / add imbalance attainable GFLOP/s w/out SIMD Stream Bandwidth w/out SW prefetch w/out NUMA +capacity miss traffic +write allocation traffic only compulsory miss traffic w/out ILP FLOPs AI = Capacity + Allocations + Compulsory actual FLOP:Byte ratio
Constructing a Roofline Model (locality walls) 256.0 128.0 64.0 32.0 16.0 8.0 4.0 2.0 1.0 0.5 1/8 1/4 1/2 1 2 4 8 16 • Remember, memory traffic includes more than just compulsory misses. • As such, actual arithmetic intensity may be substantially lower. • Walls are unique to the architecture-kernel combination Opteron 2356 (Barcelona) peak DP mul / add imbalance attainable GFLOP/s w/out SIMD Stream Bandwidth w/out SW prefetch w/out NUMA +conflict miss traffic +capacity miss traffic +write allocation traffic only compulsory miss traffic w/out ILP FLOPs AI = Conflict + Capacity + Allocations + Compulsory actual FLOP:Byte ratio
Roofline Models for SMPs 256.0 Xeon E5345 (Clovertown) 256.0 Opteron 2356 (Barcelona) 128.0 128.0 peak DP 64.0 64.0 peak DP mul / add imbalance 32.0 32.0 mul / add imbalance w/out SIMD attainable GFLOP/s 16.0 Bandwidth on small datasets attainable GFLOP/s 16.0 w/out SIMD Stream Bandwidth Bandwidth on large datasets 8.0 8.0 w/out SW prefetch w/out NUMA 4.0 w/out ILP 4.0 w/out ILP 2.0 2.0 1.0 1.0 0.5 0.5 1/8 1/4 1/2 1 2 4 8 16 1/8 1/4 1/2 1 2 4 8 16 actual FLOP:byte ratio actual FLOP:byte ratio 256.0 UltraSparc T2+ T5140 (Victoria Falls) 256.0 QS20 Cell Blade (PPEs) 256.0 QS20 Cell Blade (SPEs) 128.0 128.0 128.0 64.0 64.0 64.0 32.0 32.0 32.0 Stream Bandwidth peak DP Stream Bandwidth misaligned DMA attainable GFLOP/s 16.0 peak DP attainable GFLOP/s 16.0 attainable GFLOP/s 16.0 w/out FMA w/out SW prefetch peak DP w/out NUMA w/out NUMA 8.0 25% FP 8.0 8.0 w/out SIMD Stream Bandwidth w/out FMA 4.0 12% FP 4.0 4.0 w/out ILP 2.0 6% FP 2.0 w/out SW prefetch w/out NUMA w/out ILP 2.0 1.0 1.0 1.0 0.5 0.5 0.5 1/8 1/4 1/2 1 2 4 8 16 1/8 1/4 1/2 1 2 4 8 16 1/8 1/4 1/2 1 2 4 8 16 actual FLOP:Byte ratio actual FLOP:byte ratio actual FLOP:byte ratio • Note, the multithreaded Niagara is limited by the instruction mix rather than a lack of expressed in-core parallelism • Clearly some architectures are more dependent on bandwidth optimizations while others on in-core optimizations.
Auto-tuningLattice-Boltzmann Magnetohydrodynamics (LBMHD) Auto-tuningLattice-Boltzmann Magnetohydrodynamics (LBMHD) Chapter 6 Overview Multicore SMPs The Roofline Model Auto-tuning LBMHD Auto-tuning SpMV Summary Future Work
Introduction to Lattice Methods 12 15 0 4 6 25 18 14 2 8 23 10 21 26 20 9 11 22 17 1 13 7 5 24 3 19 16 +Z +Y +X • Structured grid code, with a series of time steps • Popular in CFD • Allows for complex boundary conditions • No temporal locality between points in space within one time step • Higher dimensional phase space • Simplified kinetic model that maintains the macroscopic quantities • Distribution functions (e.g. 5-27 velocities per point in space) are used to reconstruct macroscopic quantities • Significant Memory capacity requirements
25 LBMHD(general characteristics) 12 0 23 12 4 25 26 15 15 14 6 2 22 14 8 23 18 18 21 26 24 21 10 9 20 20 22 13 1 13 11 5 24 17 17 16 7 3 16 19 19 +Z +Z +Z +Y +Y +Y +X +X +X macroscopic variables momentum distribution magnetic distribution • Plasma turbulence simulation • Two distributions: • momentum distribution (27 scalar components) • magnetic distribution (15 vector components) • Three macroscopic quantities: • Density • Momentum (vector) • Magnetic Field (vector) • Must read 73 doubles, and update 79 doubles per point in space • Requires about 1300 floating point operations per point in space • Just over 1.0 FLOPs/byte (ideal)
LBMHD(implementation details) • Data Structure choices: • Array of Structures: no spatial locality, strided access • Structure of Arrays: huge number of memory streams per thread, but guarantees spatial locality, unit-stride, and vectorizes well • Parallelization • Fortran version used MPI to communicate between nodes. = bad match for multicore • The version in this work uses pthreads for multicore (this thesis is not about innovation in the threading model or programming language) • MPI is not used when auto-tuning • Two problem sizes: • 643 (~330MB) • 1283 (~2.5GB)
SOA Memory Access Pattern (-1,+1) (0,+1) (+1,+1) (-1,0) (0,0) (+1,0) (-1,-1) (0,-1) (+1,-1) read_array[ ][ ] x dimension ? write_array[ ][ ] • Consider a simple D2Q9 lattice method using SOA • There are 9 read arrays, and 9 write arrays, but all accesses are unit stride • LBMHD has 73 read and 79 write streams per thread
Roofline Models for SMPs 256.0 Xeon E5345 (Clovertown) 256.0 Opteron 2356 (Barcelona) 128.0 128.0 peak DP 64.0 64.0 peak DP mul / add imbalance 32.0 32.0 mul / add imbalance w/out SIMD attainable GFLOP/s 16.0 Bandwidth on small datasets attainable GFLOP/s 16.0 w/out SIMD Stream Bandwidth Bandwidth on large datasets 8.0 8.0 w/out SW prefetch w/out NUMA 4.0 w/out ILP 4.0 w/out ILP 2.0 2.0 1.0 1.0 0.5 0.5 1/8 1/4 1/2 1 2 4 8 16 1/8 1/4 1/2 1 2 4 8 16 actual FLOP:byte ratio actual FLOP:byte ratio 256.0 UltraSparc T2+ T5140 (Victoria Falls) 256.0 QS20 Cell Blade (PPEs) 256.0 QS20 Cell Blade (SPEs) 128.0 128.0 128.0 64.0 64.0 64.0 32.0 32.0 32.0 Stream Bandwidth peak DP Stream Bandwidth misaligned DMA attainable GFLOP/s 16.0 peak DP attainable GFLOP/s 16.0 attainable GFLOP/s 16.0 w/out FMA w/out SW prefetch peak DP w/out NUMA w/out NUMA 8.0 25% FP 8.0 8.0 w/out SIMD Stream Bandwidth w/out FMA 4.0 12% FP 4.0 4.0 w/out ILP 2.0 6% FP 2.0 w/out SW prefetch w/out NUMA w/out ILP 2.0 1.0 1.0 1.0 0.5 0.5 0.5 1/8 1/4 1/2 1 2 4 8 16 1/8 1/4 1/2 1 2 4 8 16 1/8 1/4 1/2 1 2 4 8 16 actual FLOP:Byte ratio actual FLOP:byte ratio actual FLOP:byte ratio • LBMHD has a AI of 0.7 on write allocate architectures, and 1.0 on those with cache bypass or no write allocate. • MUL / ADD imbalance • Some architectures will be bandwidth-bound, while others compute bound.
LBMHD Performance(reference implementation) • Standard cache-based implementation can be easily parallelized with pthreads. • NUMA is implicitly exploited • Although scalability looks good, is performance ? Performance Concurrency & Problem Size
LBMHD Performance(reference implementation) • Standard cache-based implementation can be easily parallelized with pthreads. • NUMA is implicitly exploited • Although scalability looks good, is performance ?
LBMHD Performance(reference implementation) 256.0 Xeon E5345 (Clovertown) 256.0 Opteron 2356 (Barcelona) 128.0 128.0 peak DP 64.0 64.0 peak DP mul / add imbalance 32.0 32.0 mul / add imbalance w/out SIMD attainable GFLOP/s 16.0 Bandwidth on small datasets attainable GFLOP/s 16.0 w/out SIMD Stream Bandwidth Bandwidth on large datasets 8.0 8.0 w/out SW prefetch w/out NUMA 4.0 w/out ILP 4.0 w/out ILP 2.0 2.0 1.0 1.0 0.5 0.5 1/8 1/4 1/2 1 2 4 8 16 1/8 1/4 1/2 1 2 4 8 16 actual FLOP:byte ratio actual FLOP:byte ratio 256.0 UltraSparc T2+ T5140 (Victoria Falls) 256.0 QS20 Cell Blade (PPEs) 256.0 QS20 Cell Blade (SPEs) 128.0 128.0 128.0 64.0 64.0 64.0 32.0 32.0 32.0 Stream Bandwidth peak DP Stream Bandwidth misaligned DMA attainable GFLOP/s 16.0 peak DP attainable GFLOP/s 16.0 attainable GFLOP/s 16.0 w/out FMA w/out SW prefetch peak DP w/out NUMA w/out NUMA 8.0 25% FP 8.0 8.0 w/out SIMD Stream Bandwidth w/out FMA 4.0 12% FP 4.0 4.0 w/out ILP 2.0 6% FP 2.0 w/out SW prefetch w/out NUMA w/out ILP 2.0 1.0 1.0 1.0 0.5 0.5 0.5 1/8 1/4 1/2 1 2 4 8 16 1/8 1/4 1/2 1 2 4 8 16 1/8 1/4 1/2 1 2 4 8 16 actual FLOP:Byte ratio actual FLOP:byte ratio actual FLOP:byte ratio • Superscalar performance is surprisingly good given the complexity of the memory access pattern. • Cell PPE performance is abysmal.