Download
1 / 41
450 likes | 876 Vues
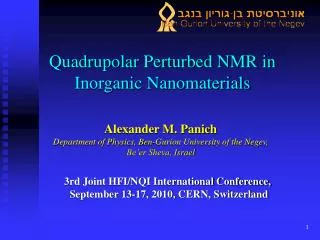
Quadrupolar Perturbed NMR in Inorganic Nanomaterials. Alexander M. Panich Department of Physics, Ben-Gurion University of the Negev, Be’er Sheva, Israel. 3rd Joint HFI/NQI International Conference, September 13-17, 2010, CERN, Switzerland. Why inorganic nanomaterials?

E N D
Quadrupolar PerturbedNMR in Inorganic Nanomaterials Alexander M. Panich Department of Physics, Ben-Gurion University of the Negev, Be’er Sheva, Israel 3rd Joint HFI/NQI International Conference, September 13-17, 2010, CERN, Switzerland
Why inorganic nanomaterials? A lot of investigations of carbon nanostructures. Their properties have been studied in detail. In contrast, our knowledge of the physical properties of inorganic nanotubes and fullerene-like species is still limited. Eventual applications in electronics, magnetic recording, as nano-bio materials, are used as low-friction materials. NMR is an excellenttool in studying the local structure, electronic structure and chemical bonding in inorganic nanoparticles. Inorganic nanoparticles often contain atoms with quadrupolar nuclei, such as 11B, 14N, 51V, 95,97Mo, etc. that nicely suit the topics of the HFI/NQI Conference.
Carbon nanotubes and fullerenes Graphite and graphene are semimetals. Solid C60 is a semiconductor. Properties of carbon nanotube (CNT) vary from metallic to semiconductor behavior depending on wrapping angle. Solid C60 is a semiconductor with energy gap 1.5–1.9 eV.
Inorganic nanotubes Similar to CNTs, layered inorganic compounds, such as BN, MoS2, etc. can also form fullerene-like and tubular nanostructures. However, they do not show such variation of physical properties as CNTs do. Similar to bulk samples, BNNTs are semiconductors with a wide energy gap 5.5 eV irrespective of diameter and chirality. Boron nitride fullerenes are wide-gap semiconductors as well. MoS2 fullerenes seem to hold the properties of bulk MoS2. Crystal lattice of hexagonal boron nitride (left) and graphite (right) Why? NMR study of electronic properties of inorganic nanomaterials.
Outline • NMR investigation of • boron nitride nanotubes, • molybdenum sulfide fullerenes, • dithallium selenide nanorods • - vanadium oxide nanotubes • - Comparison of the data for bulk and nano-sized samples helps to understand properties of the nano-sized compounds.
Boron nitride nanotubes Crystal lattice of hexagonal boron nitride Tubular BN
First NMR study of BNNTs Interpretation of 11B NMR spectrum: two components arising from BNNTs with different structures(hexagonal and rhombohedral phases)showing different chemical shift. But!But!If so, splitting should increase with increasing magnetic field. In experiment - just in opposite! Quadrupole splitting? 11B NMR spectra of BNNTs in magnetic fields of 4.7 T and 14.1 T (Jung et al, Solid State Commun., 2004).
Our study of multi-wall boron nitride nanotubes SEM and TEM images of our multiwall BN nanotubes. Averaged inner diameter ~ 7 nm, length about 1–2 mm, ~20 walls.
Our NMR study of BNNTs 11B (I=3/2) – quadrupole nucleus Hz>>HQ- the quadrupole interaction is a perturbation to the Zeeman term. I = 3 /2 - the NMR spectrum consists of 3 transitions. Central 1/2→−1/2 transition is not affected by the first order effects and is observed at the Larmor frequency, Satellites 3/2→1/2 and −1/2→−3/2 are shifted to frequencies determined by the product nQ×(3cos2q-1)/2, where nQ=e2qQ/2h. In a powder, the satellite lines are distributed over the frequency range of the order of 2nQwith the singularities at ±nQ/2 and shoulders at ± nQand are hardlydetected. Hdip ,HCS << HQ; CSA(11B) ~ 27-40 ppm in h-BN and BNNTs
Room temperature 11B NMR spectrum (A. M. Panich et al., Phys. Rev. B, 2006) Room-temperature experimental 11B NMR spectrum. From the splitting between satellites, D=nQ = e2qQ/2h the values of nQ = 1.453MHzand quadrupole coupling constant e2qQ/h = 2.906 MHz were found. Neither a splitting nor any unexpected broadening of the satellite transitions was observed, leading to the conclusion of a zero value of the asymmetry parameter h. Room temperature 11B NMR spectrum in magnetic field B0=8.0196 T. In inset, separately measured low-frequency satellite is shown.
Central (1/2→-1/2)transition The shape of the central transition is determined by the second-order quadrupolar effects. For I=3/2, line shape in powder sample exhibits two singularities with splitting D = 25nQ2/48n0 The separation between two peaks, observed at n0=16.7 MHz, is 63.5 kHz, yielding nQ=1.427 MHz and e2qQ/h=2.854 MHz. No doubts - quadrupolar splitting.
Temperature dependence of nQ Increase in nQwith decreasing temperature is mainly caused by freezing of the low-frequency torsional librations of a molecule as a whole that are large for molecular crystals but are small for the bulk h-BN and long multiwall BNNTs. Therefore the lattice dynamics of BN are mainly due to zero-point vibrations. Temperature dependence of the quadrupole Frequency in BNNTs. The quadrupole frequency in h-BN, measured at 4.2 K by SQUID, was found to be 1.467 kHz – close to that RT that confirms weak temperature dependence of nQin h-BN.
Spin-lattice relaxation measurement (n0=109.58 MHz) 11B magnetization recovery in the linear and semi-logarithmic scales may be fit as a superposition of two exponentials with very long 11B spin-lattice relaxation times T11= 76 ± 13 s, and T12 = 495 ± 21 s. How to explain?
EPR EPR signal: 10 well-resolved lines due to unpaired electron trapped in a nitrogen vacancy, which is surrounded by m=3 equivalent boron atoms. B e- B B Number of hyperfine components is N = 2×I×m + 1 = 10, where I(11B)=3/2. Density of PM centers determined by EPR, 9×10¹⁵ spin/g, is less than the estimated number of the nanotubes in our sample, thus there are nanotubes either with or without paramagnetic centers. Two exponentials may correspond to NTs with and without paramagnetic centers.
Quadrupole coupling constants of bulk h-BN and BN nanotubes at ambient temperature 23. M. Fanciulli, M. Corti, Phys. Rev. B 52, 11872 (1995). 25. A. H. Silver, P. J. Bray, J. Chem. Phys. 32, 288 (1960). 26. P.S. Marchetti, D. Kwon, W.R. Schmidt, L.V. Interrante, G.E. Maciel, Chem. Mater. 3, 482 (1991). 27. G. Jeschke, W. Hoffbauer, M. Jansen, Solid State Nucl. Magn. Reson. 12, 1 (1998). 28. K. Kanehashi, K. Saito, J. Molec. Struct. 602-603, 105 (2002).
Discussion Closeness of QCC of the MW BNNTs and bulk h-BN reflects: similar chemical bonding, similarcharge distribution over B-N bond, and similarlocal symmetry. These findings should result in similar electronic properties. That is why BN nanotubes are semiconductors with a nearly constant energy gap of5.5 eV regardless of diameter, chirality, number of walls of the tube, and this gap is close to that of bulk h-BN (experiment: ~5.8 eV, calculations: 5.4-5.5 eV).
Discussion (continued) Perhaps only BNNTs with very small diameter would show different electronic properties with respect to those of bulk h-BN and a decrease of the band gap caused by the curvature of the sheets and appearance of some sp2→sp3 re-hybridization. Energy gaps of BN nanotubes vs radius (H.J. Xiang et al, Phys. Rev. B, 2003)
Bond length of the BN nanotubes as a function of diameter. Solid line - bond length of h-BN. (Moon et al, Physica E, 2004) Bond lengths of BN-NT’s as a function of tube radius. Yellow line - bond length in h-BN, 1.446 Å (Akdim et al, Phys. Rev. B, 2003). Calculations: B-N bond length in nanotubes is 1.438 Å, almost equal to the experimental value in bulk h-BN 1.446 Å. Very small variations in the bond length with tube radius, except for BNNTs with very small diameter. Our BNNTs: average inner diameter ~ 7 nm, length about 1–2 mm, ~ 20 walls ranging from 8 to 40 layers.
Inorganic Fullerenes (IF) MoS2 2H-MoS2: triple S–Mo–S layers bound by van der Waals forces TEM image of IF-MoS2 particle. Armchair (top) and zigzag (bottom) MoS2 nanotube (Seifert et al., PRL, 2000) A polyhedral onion-like structure, size ~ 40 nm, 20–30 MoS2 layers, interlayer distance of 0.62 nm as in bulk 2H-MoS2.
First 95Mo NMR study of IF-MoS2 and, for comparison, of bulk 2H-MoS2 sample (Panich et al, J. Phys. Condensed Matter, 2009) 95Mo (15.7%) and 97Mo (9.5%), I = 5/2 – quadrupole nuclei. Low natural abundance, low resonance frequency (22.2 MHz in B0 = 8 T), broad spectra due to quadrupole coupling and very long spin–lattice relaxation time in nonmetallic specimens, make measurements of Mo NMR spectra in powders difficult. Only a few Mo NMR measurements in solids, some of them - using 95Mo enriched samples. T.G. Bastow: 95Mo NMR of bulk 2H-MoS2 with natural abundance of the 95Mo. Was in two minds, whether line shape is caused by second-order quadrupole interaction, by chemical shielding anisotropy, or by both these effects.
For the axially symmetric electric field gradient (h = 0) caused by the axial (threefold) symmetry of the Mo site, the second order shift of the central component is • = cosq, where q is the angle between the principal axis of the electric field gradient and the applied magnetic field, and n0 is the Larmor frequency. Spacing between the two peaks is For I =5/2
Experimental room temperature 95Mo NMR spectra of bulk 2H-MoS2 (bottom) and IF-MoS2 (top) samples and the simulated spectra (blue lines). Our measurements in B0 = 8 T reveal nearly the same splitting D = 41.2 and 41.6 kHz for IF and bulk samples, respectively. Bastow, bulk 2H-MoS2, 9.4 T, 26.06 MHz : D = 42.7 kHz. Since quadrupolar splitting D ~ 1/n0, smaller D ~ 35 kHz is expected. The only way to reconcile our data with those of Bastow is to take into account a contribution of chemical shielding anisotropy to the NMR line shape for powder samples, which may be essential for heavy nuclei such as 95Mo.
For the axially symmetric shielding tensor, this contribution is described by the expression Combined nuclear quadrupole and anisotropic chemical shift effects in a single crystal result in the following expression for the central transition In a powder, the line shape possesses two singularities and a step, with splitting between the maxima
our case Abscissa, (n-n0), in units Jones W.H., Graham T.P. and Barnes R.G., Phys. Rev.132 1898 (1963)
95Mo spectra simulation using DMfit2009 software (D. Massiot et al., Magn. Reson. Chem. 40 70 (2002)). r~-1.47 NMR parameters for bulk and nanoparticles are close to each other.
Discussion 1. MoS2 nanoparticles exhibit QCC and CSA similar to that in bulk compound, reflecting similar local crystal structure, local symmetry, chemical bonding, and charge distribution over the Mo–S bondin bulk and IF samples. This fact results in similar electronic properties of these materials. It seems that Mo–S bonds are strong enough to hold Mo–S and Mo–Mo distances and are little affected by weak curvature of the layers. Perhaps only single-wall IFs with very small diameter and large curvature would show different electronic properties compared to those of bulk. Multiwall –> close to bulk. Is there any difference between bulk and nano?
95Mo Spin–lattice relaxation measurements: very long spin–lattice relaxation times T1 ~ 255 s and 122 s for bulk MoS2 and IF-MoS2, respectively. Reduced T1 in IF-MoS2 compared with that in bulk sample is attributed to larger density of paramagnetic defects and to interaction of nuclear spins with electron spins of these defects, which gives rise to effective spin-lattice relaxation channel.This is confirmed by EPR measurements: N = 1.9 × 10¹⁶ spin/gfor bulk 2H-MoS2 and N =1.16 × 10¹⁷ spin/g for IF-MoS2. MoS2-IF have more defective structure than the bulk sample. Nearly defect-free MoS2 flat faces with a limited number of defects at the edges of polyhedral nanoparticles appearing upon folding of the triple MoS2 sheets, when some atoms are left unbound and form defects withdangling bonds. Such defects arise from the difficulty in formation a perfect polyhedral structure by the folding of triple MoS2 layers.
Attempt to observe an NMR signal from the 97Mo isotope Since the quadrupole moment eQ of 97Mo is 11.5 times larger than that of 95Mo and since the relaxation time T1 is proportional to (eQ)−2, one can expect a much shorter T1 for 97Mo which could be of a great advantage in the present experiments. However, the linewidth of the central transition caused by second-order quadrupolar interaction varies as (eQ)2 and thus should yield a linewidth of the order of 5.5 MHz. Therefore the 97Mo NMR signal was not detected.
Conclusion on BNNTs and MoS2-IFs Multiwall BN nanotubes and multishell inorganic fullerenes MoS2 exhibit QCC and CSA similar to those in the bulk compounds, reflecting similar local crystal structure, chemical bonding, and charge distribution over the B-N and Mo–S bonds in bulk and nano-materials. These findings result in similar electronic properties of the corresponding bulk and nano-materials.
Tl2Se: properties of inorganic nanomaterial differ from those of bulk samples Comparative NMR study of bulk and nanorod samples of Tl2Se The average size of Tl2Se nanorods is about 75 nm in diameter and 900 nm in length. (A. M. Panich, M. Shao, C. L. Teske, W. Bensch, Phys. Rev. B, 2006)
Tl2Se nanorods show a regular chemical shift, bulk Tl2Se exhibits Knight shift characteristic of conductors, which originates from the hyperfine interaction between nuclear spins and conduction electrons. However, Knight shift in bulk Tl2Se (0.3%) is much smaller than that in Tl metal (1.6% of the Larmor frequency). Such value is characteristic of a semimetal showing reduced density of states (DOS) at the Fermi level. 205Tl NMR spectra of bulk and nanorod Tl2Se samples at T=291 K and B0=8.0196 T. Spin-lattice relaxation:Korringa term in Tl2Se, 1/T1T = 1.2 s-1K-1, is much smaller than that of Tl metal, 1/T1T ≈ 330s-1K-1, indicating much smaller DOS at the Fermi level of Tl2Se in comparison with that in metallic thallium; such value is characteristic of semimetals.
Tl2Se nanorods are semiconductors and exhibit a characteristic activation behavior in the spin-lattice relaxation rate due to the thermal excitation of carriers to the conduction band. The activation energy was determined to be DE =0.24 eV. Temperature dependence of 205Tl spin-lattice relaxation rate of Tl2Se nanorod sample in B0=8.0196 T. Exponential fit is shown by dotted line.
In semimetal conduction and valence bands touch each other. Such band structure is sensitive to different effects, which may cause gap opening. Size reduction can significantly change the properties of the compound. Analogous bulk-to-nano transformation of insulators and wide gap semiconductors does not show visible changes in their properties.
Vanadium oxide nanotubes Vanadium oxides often crystallize as layered compounds. They may be diamagnetic, paramagnetic, ferromagnetic, show metal-insulator transition, superconductivity, etc. VOxNTs are of interest due to their application in spintronics, which requires fabrication of magnetic nano-structures. VOx alkylamine Structure of VOxNTs is composed of scrolled V7O16 layers between which alkylamine molecules (acting as the structure-directing agents) are embedded. They are considered to be of mixed valence containing V4+ and V5+ ions, which would be seen in the NMR spectra. TEM image of the VOx nanotube
VOx-decylamine nanotubes [CH3(CH2)9NH2]-VOxNT or C10-VOxNT 51V NMR spectrum: 3 peaks at ~89.73 MHz, ~89.93 MHz and ~90.06 MHz. Position of the low frequency line is close to that of diamagnetic VOCl3 and is attributed to diamagnetic V5+ ions. High frequency resonances reveal a "paramagnetic" shift of 200 - 300 kHz and are assigned to two inequivalent paramagnetic V4+ ions. The ratio of the intensities Id/(Ip1+Ip2) ~ 2.13, which yields a rough estimation of 68% of V5+ and 32% of V4+ ions. Room temperature 51V NMR spectrum of VOx nanotubes. Arrow shows position of VOCl3 reference.
Two main contributions to spin-lattice the relaxation (NSLR): Quadrupole contribution to NSLR results from modulation of quadrupole interaction by lattice vibrations, yielding temperature dependence and for low and high temperatures, respectively. Increase in T1 on coolingin the high temperature region is attributed to the quadrupole contribution to the NSLR. Temperature dependence of 51V spin-lattice relaxation time in VO-NTs Magnetic contribution to NSLR due to coupling of nuclear spins with electron spins of the paramagnetic ions w0 - NMR frequency, te - electron correlation time. te~10-9-10-12 s, w0te<<1 and R1~te0exp(E/kBT) T1m decreases on cooling, which explains our experimental data in the low temperature region. The interplay of paramagnetic and quadrupolar contributions yields T1(T) dependence observed in the experiment.
Summary onVOxNTs Our NMR study of the multiwall vanadium oxide - decylamine nanotubes reveals diamagnetic V5+ and two paramagnetic V4+ ions, respectively. The amount of the V4+ ions was estimated as ~32% from the line intensities of the NMR spectra. 51V spin-lattice relaxation data comprise both magnetic and quadrupolar contributions.
Collaboration : Crystal growth and characterization: C. C. Tang, National Institute for Materials Science, Tsukuba, Japan R. Rosentsveig and R. Tenne, Weizmann Institute for Science, Rehovot, Israel Cheol Eui Lee, Department of Physics and Institute for Nano Science, Korea University, Seoul, Korea C. L. Teske and W. Bensch,Christian-Albrechts University, Kiel, Germany
Semimetal-semiconductor transformation on reduced size due to quantum confinement Metal particle: quantum confinementis observed when the size is reduced to a value corresponding to the de Broglie wavelength; the density of states in the valence and conduction bands decreases, causing metal-nonmetal transition. Metals: de Broglie wavelength of the carriers is of the order of the lattice spacing. Thus quantum confinement is visible only for very small particles. Semimetals and semiconductors: de Broglie wavelength may exceed the lattice spacing by several orders of magnitude, thus quantum confinement may be observed for rather large nanoparticles, i.e. for Tl2Se nanorods with diameter of 75 nm and length of 900 nm. Another example: semimetal Biexhibits quantum confinement effects at a film thickness of ~100 nm. Bi nanowires show semimetal-semiconductor transition as the wire diameter is reduced down to 250 nm (Dresselhaus et al, Farhangfar). Semiconductors show an increased band gap with reduction of size due to quantum mechanical effects.
Metals: Korringa relation that arises from the interaction of nuclear spins with conduction electrons In bulk Tl2Se, the Korringa-like spin-lattice relaxation behavior is observed at low temperatures and is transformed to an activation regime above ~200 K. Interpretation: two-band model in the semimetallic compound, in which one band touches the Fermi level, while the second band is separated from the Fermi level by an energy gap DE. In this case, the relaxation rate is given by the expression Temperature dependence of 205Tl spin-lattice relaxation rate of Tl2Se bulk sample in B0=8.0196 T. Linear fit at low temperatures is shown by dotted line. DE = 0.16 eV. Normally, the spin contribution to 1/T1KT is proportional to the DOS at the Fermi-level. From linear fit of the data below 200 K, we obtained 1/T1KT = 1.2 s-1K-1, that is much smaller than that of Tl metal, 1/T1T ≈ 330s-1K-1. The obtained value of 1/T1T indicates much smaller DOS at the Fermi level of Tl2Se in comparison with that in metallic thallium; such value is characteristic of semimetals.