
Abstract
RELATIONSHIPS BETWEEN ERODIBILITY AND FINE-GRAINED SEABED PROPERTIES ON TIDAL TO SEASONAL TIME-SCALES, YORK RIVER ESTUARY, VA. Drier in Summer. r = + 0.20 . r = - 0.43. r = + 0.35 . r = - 0.51. Gust eroded mass (kg/m^2) at 0.2 Pa. River flow (m 3 /s). r = + 0.89 r 2 = 0.79.

Abstract
E N D
Presentation Transcript
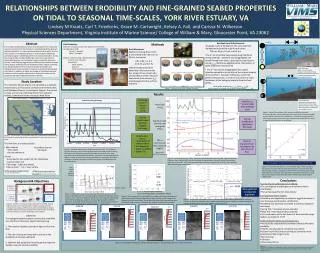
RELATIONSHIPS BETWEEN ERODIBILITY AND FINE-GRAINED SEABED PROPERTIES ON TIDAL TO SEASONAL TIME-SCALES, YORK RIVER ESTUARY, VA Drier in Summer r = + 0.20 r = - 0.43 r = + 0.35 r = - 0.51 Gust eroded mass (kg/m^2) at 0.2 Pa River flow (m3/s) r = + 0.89 r2 = 0.79 Salinity in main channel near coring site (PSU) 1 m above bottom Pellet Abundance (% dry wgt.) U* r = + 0.75 (b) Sand (% dry wgt.) (c) Organics (% dry wgt.) (a) Water (% by vol.) Eroded Mass (kg/m2) at 0.2 Pa Lindsey M Kraatz, Carl T. Friedrichs, Grace M. Cartwright, Kelsey A. Fall, and Carissa N. Wilkerson Physical Sciences Department, Virginia Institute of Marine Science/ College of William & Mary, Gloucester Point, VA 23062 Near surface r = + 0.43 r = - 0.08 r = - 0.97 Tidal range (m) Observed eroded mass at 0.2 Pa Only significant 1-component regression Stratification favors: 1 m above bottom r = + 0.95 r2 = 0.90 TSS in main channel near coring site (mg/L) Boxes are tidal range for previous 5 days • convergence of sediment flocs • net deposition • higher erodibility • higher TSS Near surface Days starting 1 April 2010 (d) Mud (% dry wgt.) (f) Pellets (% dry wgt.) (e) Mud matrix % solids (Data sources: USGS & EPA monitoring) Abstract The complex bio-geo-physical nature of muddy particles in coastal and estuarine environments has limited our understanding of fine-grained sediment dynamics. An ongoing sedimentalogical study within the York River Estuary is investigating controls on cohesive bed erodibility by assessing changes in seabed properties over varying timescales. During the spring of 2010, multiple GOMEX box cores were collected and subsampled for grain size, fecal pellet content, erodibility, and water content. Initial findings suggest that erodibility of the seabed increased during periods following seasonal deposition events. Higher erodibility was also generally found to coincide with peak spring tides and following storm events, perhaps in response to enhanced physical bed disturbance. In addition, a higher percentage of flocculated sediment relative to resilient pellets were found to makeup the surface of the seabed during high erodibility depositional periods. • Resilient Fecal Pellet Presence • Analyzed 2 sets of 10.00g from the same sediment • Samples were sieved through 4 mesh sieves • 150 µm, 90 µm, 63 µm, and 45 µm • The 1st set of sediment was sieved using traditional sieving methods. Sediment was disaggregated and sieved through each sieve, capturing the original grain size (φoriginal)before any agglomeration, flocculation, or pellet production had occurred • The 2nd set was not disaggregated and careful attention was paid as to not disturb the original integrity of the sediment. Seawater (15‰) was used in the gentle sieving process, in order to not cause any rapid breakdown of the biological material from the fecal pellets. • Fecal pellet weight g=φcollectedtot(g)-φoriginaltot(g) • Fecal pellet % of sample= Fecal pellet weight (g)/φoriginaltot(g) Methods Month in 2010 U* • Field Sampling: • Sediment sampling cruises were taken to coincide with spring/neap in 2010 • Spring ~ 3 samples • Neap ~ 2 samples • Samples collected using a Gomex Box Core • Sliced at 1 cm intervals • Sampled for • water content • grain size • resilient pellet presence and concentration C1 + C2 x (Time) – C2 x (Tide Range) C1 – C2 x Time (net erosion effect) + C3 x Tide Range (lower consolidation effect) Pellet abundance increases with time and decreases with tide range Gust Microcosm: Applied increasing shear stress to the seabed within the core at 20 min. increments 0.01, 0.05, 0.1, 0.2 0.3 0.45, and 0.6 Pa Filtered eroded material to determine initial erosion rate (E0), along with an erosion rate constant (M), and the initial and final critical shear stresses (τce) actually applied to the surficial sediment Larger tidal ranges Higher current velocities Increased water column mixing Resuspension of bottom sediments Less time for bed consolidation Easily erodible material • Study Location • The York River Estuary (Figure 1) is classified as a partially-mixed estuary, formed at the confluence of the Pamunkey and Mattaponi Rivers in southeastern Virginia. The estuary is linear and narrow, stretching 50 km from Goodwin Islands, at the mouth of the estuary, to West Point. • Figure 1: The York River. The Clay Bank study site is indicated by the black circle. Two long term monitoring stations, located within the York, are shown as red boxes. • The York River is characterized by: • Main channel • ~10m depth • silty clay sediments • Shoals • dominated by fine sands from the Pleistocene • inactive oyster reef • Tidal range ~ 0.8m (microtidal) • Tidal currents ~ 1 m s-1 near surface • ETM located at West Point Figure 3. Resilient Fecal Pellet Method Schematic Results Discharge occurs in winter/ early spring Small Tidal Range Decreased current velocities Minimal water column mixing Decreased bottom shear stresses More time for bed consolidation Less erodible material Study Focus: ~1 month after river discharge peak Figure 8. Spring Tide and Neap Tide sediment erodibility schematic. During spring tides, cohesive sediment beds were found to be more erodible as there was less time for bed consolidation. Conversely, during neap tides, when weak currents, were present, less sediment was eroded due to a more compact bed that had time to consolidate. Salinity stratification develops (lagging discharge) Salinity stratification significantly decreases Leads to transition from convergence to net erosion of flocs • Secondary channel • ~ 5m depth Figure 4. York River Discharge for the first 6 months of 2010. The York River typically has a wet spring and during 2010, there were steady increases during this time as the freshet was released and peaked in early April. This study focused on the sediment bed characteristics, just as the river discharge began to decline, in order to capture the transition between wet spring and dry summer conditions. Data was acquired from USGS river gauges in the Mattaponi and Pamunkey Rivers. Figure 5. York River discharge, salinity, and total suspended solids at the Clay Bank region during 2010. The green boxes indicate high river flow discharge during the winter and early spring, just before the beginning of the study. The purple boxes delineate the 5 week study period, just as the river discharge declined and began to equilibrate. Figure 9. Fecal pellet abundance vs. time and tidal range. Pellet abundance was found to increase with time presumably because as the sediment bed was reworked, smaller components of the fines were winnowed away leaving pellets behind. Conversely, pellet abundance decreased in response to spring tide, perhaps because they were dispersed or broken up during periods of highest stress. • STM found seasonally at Clay Bank (Estuarine Turbidity Maximum) (Secondary Turbidity Maximum) Conclusions Two main factors affecting bed erodibility •The convergence and divergence of sediment due to stratification •The spring-neap effect on tidal velocity Environmental factor analysis •Erodibility was negatively correlated to lagged decreases in river discharge and therefore stratification •Erodibility was positively correlated to previous changes in tidal range •Spring Tide ~ Increases erosion potential •Neap Tide ~ Decreases erosion potential •The combination of the two factors of time and tidal range leads to a correlation of .89 Sediment Bed Properties and Comparisons •No classically expected bed parameters directly affect bed erodibility •EXCEPT…the abundance of resilient fecal pellets Resilient Fecal Pellets may be serving as a proxy for other parameters influencing the area •Bed armoring •Cohesion •Winnowing of fines Background & Objectives Wetter in Spring Figure 5. Eroded mass captured using the Gust Microcosm at a stress 0.2 Pa showed a decrease over time, corresponding to minimal river discharge with an r-value to -0.51. Due to the misfit around the line, tidal range for 5 days before the sediment sampling was analyzed. As tidal range increased, erodibility increased . Conversely as tidal range decreased , erodibility decreased as well. The correlation of tidal range to erodibility gave an r-value of 0.75 Figure 6. A least squares fit, combing both time elapsed since peak discharge and tidal variation, shows that during periods of higher erosion the tidal range is low, allowing the bed to consolidate. Sampling periods when tidal range was high were correlated to high erosion, as sediment was not able to settle and consolidate. Figure 7. An analysis of parameters that are classically expected to effect erodibility were conducted. Contrary to what was expected, many variables appeared to have no statistical correlation, except to the presence of fecal pellets, with had a negative correlation of 0-.97 Figure 2. York River conceptual model (Dickhudt et al, 2009). During high river flows, the estuary becomes stratified, causing sediment convergences, allowing a STM to form and is characterized by a highly erodible seabed. Conversely, during low river flow periods, the estuary becomes well mixed and the seabed has low erodibility. 5/20/10 5/27/10 5/11/10 5/5/10 • Objectives • To investigate seabed properties and surface erodibility on a short-term timescale. Specifically observing: • 1. The transition between periods of high and low river flow • 2. The role of spring and neap tidal currents on the erodibility of cohesive sediments • 3. Sediment bed properties (including particle types) to decipher controls on bed erodibility 4/29/10 12.5 cm Figure 8. X-radiography, 7Be activity, and fecal pellet percentage of the Clay Bank study site for the 5 week period. Reference: Dickhudt, P.J., C.T. Friedrichs, L.C. Schaffner, and L.P. Sanford, 2009. Spatial and temporal variation in cohesive sediment erodibility in the York River estuary: a biologically-influenced equilibrium modified by seasonal deposition. Marine Geology, 267: 128-140.


