Download
1 / 30
310 likes | 439 Vues
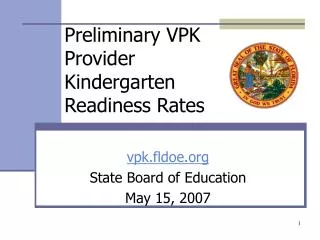
Preliminary VPK Provider Kindergarten Readiness Rates. vpk.fldoe.org State Board of Education May 15, 2007. Preliminary VPK Provider Kindergarten Readiness Rates. Children who participated in the VPK program

E N D
Preliminary VPK Provider Kindergarten Readiness Rates vpk.fldoe.org State Board of Education May 15, 2007
Preliminary VPK Provider Kindergarten Readiness Rates • Children who participated in the VPK program performed better on the kindergarten screening that children who did not participate. • Florida’s first Provider Kindergarten Readiness Rate reflects the performance of 82% of all VPK providers. • Eighty-five percent of Florida’s VPK providers earned a readiness rate of 200 or more out of a possible 300 points.
Data • All VPK Children and Providers • VPK vs. Non-VPK Kindergarten Screening Results • Readiness Rate Calculation • VPK Providers Included in Preliminary Rates • Preliminary Readiness Rates
2005-06 All VPK Children 100,214 Children in School-Year Programs + 12,615 Children in Summer Programs • 112,829 Total Children Enrolled
38.88% Male 38.26% Female 22.86% Unknown (not matched) 32.27% White 20.85% Hispanic 18.06% African American 5.96% Other 22.86% Unknown (not-matched) 15.57% English Language Learners 6.71% Children with Disabilities 35.22% Free/Reduced Price Lunch 2005-06 VPK Children (112,829)
ALL VPK Providers 3,987 School-Year Providers (82% Private Centers) + 594 Summer Providers (48% Public Schools) • 4,581 Total VPK Providers
2005-06 VPK Providers (4,581) Provider Type Faith-Based
AWI Files VPK Provider Type VPK Children Faith-Based Status DOE Files Kindergarten Demographics Kindergarten Screening Results Data Matching
Kindergarten Screening • Subset of the Early Childhood Observation System (ECHOS) • Two measures of Dynamic Indicators of Basic Early Literacy Skills (DIBELS) (Letter Naming Fluency and Initial Sound Fluency)
Readiness Rate • The kindergarten readiness rates must be based exclusively upon the results of the statewide kindergarten screening for students completing the Voluntary Prekindergarten Education Program, beginning with students completing the program during the 2005-2006 school year who are administered the statewide kindergarten screening during the 2006-2007 school year.
DOE Readiness Rate Calculation Provider/Coalition Data Coalitions Agency for Workforce Innovation (AWI) Database Department of Education (DOE) Database Providers A W I Provider Verification/Coalition Review
Rule 6A-1.099821, FAC • VPK Provider Kindergarten Readiness Rate • Accuracy of Data • Preliminary Rates – Providers with at least four children who: • were enrolled for 85% or more • participated in each of the three measures • Dispute Process • Minimum Rate Set by State Board of Education
Demographics of All VPK Children Compared to VPK Children in Rate
2005-06 Providers in Readiness Rates • School-Year Program Providers (3,987) 2,657/3,267 Private Centers (81.33%) 567/593 Public Schools (17.28%) 9/16 Private Schools (0.27%) 49/111 Family Child Care Homes (1.49%) 3,282/3, 987 82.32%
2005-06 Providers in Readiness Rates • Summer Program Providers (594) 264/286 Public Schools (92.30%) 193/306 Private Centers (63.07%) 0/1 Private Schools (0%) 0/1 Family Child Care Homes (0%) 457/594 76.94%
2005-06 Preliminary Readiness Rates by Quartile • 1st Quartile 75<=219 • 2nd Quartile >219<=244 • 3rd Quartile >244<=265 • 4th Quartile >265<=300
Percent of Providers by Coalition in 1st Quartile (75 <=219)
Percent of Providers by Coalition in 4th Quartile (>265<=300)
2005-06 Preliminary Readiness Rates Distribution (3,739) 1,592 1,586 481 72 8 0
Next Steps • Appeals Process • Submit by May 29th • DOE Review of Appeals • Review by June 12th • State Board Adopts of Minimum Readiness Rate • June 19th • Improvement Process • Acknowledge low performing provider status by July 10th
Contact Information Office of Early Learning Florida Department of Education (850) 245-0445 earlylearning@fldoe.org