Download
1 / 44
440 likes | 613 Vues
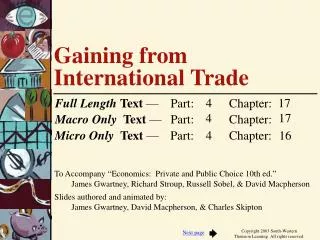
Gaining From International Trade. The Trade Sector of the United States . Imports (% of GDP). Exports (% of GDP). Imports as a Share of GDP. 20. The Growth of the U.S . Trade Sector. 15.

E N D
Imports (% of GDP) Exports (% of GDP) Imports as a Share of GDP 20 The Growth of the U.S. Trade Sector 15 • As is shown here, both exports & imports have grown substantially as a share of the U.S. economy during the last several decades. Their growth has accelerated since 1980. • Reductions in both transportation and communication costs, as well as lower trade barriers have contributed to this growth. 10 5 0 1960 1970 1980 1990 2000 2010 Exports as a Share of GDP 20 15 10 5 15th 0 edition 1960 1970 1980 1990 2000 2010 Gwartney-Stroup Sobel-Macpherson
Leading Trading Partners of the U.S. 16.1% 14.0% –––––––– Percent of Total U.S. Trade, 2012 –––––––– 12.9% • Today, Canada, China, Mexico, and Japan are the leading trading partners with the United States. • The impact of international trade varies across industries. In some industries, U.S. firms are able to compete quite effectively, while in others they find it difficult to do so. Canada 5.7% 4.1% China 2.9% Mexico 2.6% Japan 2.0% Germany 1.9% U.K . 1.9% South Korea Brazil 35.9% Saudi Arabia France All other
Gains from Trade: An Overview • Most international trade is not between the governments of different nations but rather between the people and firms located in different countries. • Like other voluntary exchanges, international trade occurs because both the buyer and seller expect to gain, and generally do. • If both parties did not expect to gain, they would not agree to the exchange. • With trade, a country’s residents can gain by specializing in the production of goods they can produce economically. • They can sell those goods in the world market and use the proceeds to import goods that would be expensive to produce domestically.
Law of Comparative Advantage • Law of Comparative Advantage:A group of individuals, regions, or nations can produce a larger joint output if each specializes in the production of goods in which it is a low-opportunity cost producer and trades for goods for which it is a high opportunity cost producer.
Gains from Specialization and Trade • International trade leads to mutual gain because it allows each country to specialize more fully in the production of those things that it does best according to the law of comparative advantage. • Trade makes it possible for each country to use more of its resources to produce those goods and services that it can produce at a relatively low cost. • With trade, it will be possible for the trading partners to consume a bundle of goods that it would be impossible for them to produce domestically.
The Importance of Economic Growth • Columns (1) and (2) indicate the daily per worker output of the food and clothing industry in the U.S. & Japan. • If the U.S. moves 3 workers from clothing to food, it produces 6 more units of food and only 3 fewer of clothing. • If Japan moves 1 worker from food to clothing, it produces 9 more units of clothing and only 3 fewer of food. • With such a reallocation of labor, the U.S. and Japan are able to increase their aggregate output of both food and clothing. Potential changein output* Output perworker day Food Clothing Food Clothing (1) (2) (3) (4) Country U.S. 2 1 + 6 - 3 Japan 3 9 - 3 + 9 Change in total output + 3 + 6 * Change in output if US shifts 3 workers from clothing to food industry and if Japan shifts one from food to clothing.
Production possibilities, Japan R Production possibilities, U.S. J1 M US1 S N United States Clothing(million units) 450 PPC Before Specialization and Trade 400 350 300 • Here we illustrate the daily production of the labor force of both the US (200 million) and Japan (50 million) given the production costs of food and clothing from the previous slide. • In the absence of trade, consumption possibilities will be restricted to points like US1 in the U.S. & J1 in Japan. • Each of these points lies along the production possibilities curve (PPC) of the respective nation. 250 200 150 100 50 Food(million units) 100 200 300 400 Clothing(million units) 450 Japan 375 300 225 150 75 Food(million units) 225 300 450 75 150
R O Consumption possibilitiesof U.S. withtrade Consumption possibilitiesof Japan with trade J1 M US1 T S N United States Clothing(million units) 450 Trade Expands Consumption Possibilities 400 350 300 • Specialization and trade expand consumption possibilities. • If the U.S. trades food for clothing (1-for-1), it can specialize in the production of food and consume along the O-Nline (rather than its original production-possibilities constraint, M-N). • Similarly, if Japan trades clothing for food (1-for-1), it can specialize in the production of clothing and consume any combination along the R-Tline (rather than its original, R-S). 250 200 150 100 50 Food(million units) 100 200 300 400 Clothing(million units) 450 Japan 375 300 225 150 75 Food(million units) 225 300 450 75 150
R O 250 M J2 J1 US2 US1 200 T S N United States Clothing(million units) 450 Trade Expands Consumption Possibilities 400 350 300 • For example, with specialization and trade, the U.S. could increase its consumption from US1 to US2, gaining 50 million units of clothing and 100 million units of food. • Simultaneously, Japan could increase consumption from J1to J2, a gain of 125 million units of food and 25 million units of clothing. 250 200 200 200 150 100 50 Food(million units) 200 100 200 300 400 200 Clothing(million units) 450 Japan 375 300 225 150 75 Food(million units) 225 300 450 75 150
R O Japan exports 250 M J2 J1 US2 US1 US imports 200 T S N Japan imports US exports United States Clothing(million units) 450 Trade Expands Consumption Possibilities 400 350 300 • How exactly do the U.S. and Japan consume at US2 and J2? • The U.S. produces 400 million units of food, consumes 200 million, and exports 200 million to Japan. • Japan produces 450 million units of clothing, consumes 250 million, and exports 200 million to the U.S.. • Each consumes more than it could produce domestically. 250 200 200 150 100 50 Food(million units) 200 100 200 300 400 Clothing(million units) 450 Japan 375 300 225 150 75 Food(million units) 225 300 450 75 150
International Trade is a Key to Prosperity • In addition to gains from specialization in areas of comparative advantage, international trade also leads to gains from: • Economies of Scale:International trade allows both domestic producers and consumers to gain from reductions in per-unit costs that often accompany large-scale production, marketing, and distribution. • More Competitive Markets:International trade promotes competition in domestic markets and allows consumers to purchase a wider variety of goods at economical prices.
Sw Price Price Sd Sw c Dw Dd Soybeans (bushels) Soybeans (bushels) U.S. Has a Comparative Advantage • The price of soybeans and other internationally traded commodities is determined by the forces of supply and demand in the world market. • If U.S. soybean producers were prohibited from selling to foreigners, the domestic price would be Pn. • Free trade permits U.S. soybean producers to sell Qpunits at the higher world price of Pw. U.S. Market World Market a b Pw Pw Pn Qc Qn Qp Qw
Sw Price Price Sd Sw c Dw Dd U.S. exports Soybeans (bushels) Soybeans (bushels) U.S. Has a Comparative Advantage U.S. Market World Market • At the world price of Pw, the quantity (Qp– Qc) is exported. • Compared to the no-trade situation, the producers’ gain from the higher price (area) Pw–b – c– Pnexceeds the cost imposed on domestic consumers (area) Pw – a– c – Pnby the triangular (area) a– b – c. a b Pw Pw Pn Qc Qn Qp Qw
Price Price Sd Sw a Dd Dw Shoes (pairs) Shoes (pairs) Foreigners Have a Comparative Advantage • Consider the international market for manufactured shoes. • In the absence of trade, the domestic price would be Pn. • As many foreign producers have a comparative advantage in the production of shoes, international trade leads to lower prices Pw. U.S. Market World Market Pn Pw Qn Qw
Price Price Sd Sw a Sw Dd Dw U.S. imports Foreigners Have a Comparative Advantage U.S. Market World Market • At the price Pw, U.S. consumers demand Qcunits of which (Qc– Qp) are imported. • Compared to no trade, consumers gain (area) Pn– a – b– Pw, while domestic producers lose (area) Pn–a – c – Pw. • A net gain of (area) a–b– cresults. Pn b c Pw Pw Shoes (pairs) Shoes (pairs) Qn Qw Qp Qc
Summary: Supply, Demand, and Gains from Trade • International trade and specialization result in lower prices (and more domestic consumption) for imported products and higher prices (and less domestic consumption) for exported products. • Trade makes it possible for domestic producers to obtain higher prices for the items they export and for domestic consumers to buy imported items at lower prices. • As a result, the residents of each nation are able to focus more of their resources on the things they do best (produce at a low cost), while trading for those goods for which they are high opportunity cost producers.
Questions for Thought: • State the law of comparative advantage in your own words. • Under what conditions can a nation gain from international trade? • Do you think the 50 states of the United States would be better off if each imposed trade barriers limiting trade across state boundaries? Do you think the countries of North and South America would be better off if there were no trade restrictions limiting trade across national boundaries? Explain your response.
Questions for Thought: 4. Are the following statements true or false? (a) “If a nation is going to produce its maximum potential output and achieve full employment, it must impose tariffs and quotas in order to protect domestic industries & jobs.” (b) “Everyone benefits when trade barriers (for example, tariffs and quotas) are removed.” (c) “When a country trades for those things for which it is a high cost producer, it will be able to use more of its resources to produce items it can produce at a low cost.”
Economic Freedom and Growth U.S. Average Tariff Rate Duties Collected as a Percentage of Dutiable Imports 60 • The average tariff rate (taxes levied upon imports) for the United States (since 1890) is illustrated here. 50 40 30 20 3.5% 10 0 1890 1910 1930 1950 1970 1990 2010
Imports after tariff Tariff =t S U T V Initial imports Trade Restrictions: Impact of a Tariff • Consider a tariff on auto imports. • Without a tariff, world price is Pw. At Pw consumers in the U.S. purchase Q1 units … Price SDomestic Qd1 from U.S. producers and … Q1– Qd1from foreign producers. • A tariff (t ) makes it more costly for Americans to purchase autos from abroad. U.S. prices rise to Pw+ tand purchases fall from Q1to Q2. Pw+ t • U.S. purchases from domestic producers rise from Qd1to Qd2… Pw imports fall to Q2 – Qd2. Ttax revenues (from the tariff) are generated … • Producers gain S… DDomestic U & Vare deadweight losses. Quantity(automobiles) Qd1 • Consumers lose S+U+T+Vin the form of higher prices and a reduction of consumer surplus. Qd2 Q2 Q1
Import quota:Q2 – Qd2 S U T V Initial imports Trade Restrictions: Impact of a Quota • Consider a quota on peanuts. • Without trade restraints, Pw(world price) would be the domestic price. At PwU.S. consumers would purchase Q1 … Price SDomestic Qd1 from U.S. producers and … Q1– Qd1from foreign producers. • A quota of Q2– Qd2imports pushes the U.S. price up to P2. P2 • While total U.S. purchases fall (from Q1to Q2 ), those from U.S. rise (from Qd1 to Qd2) and … Pw imports fall to Q2 – Qd2. • U.S. producers gain S. Area Tgoes to foreign producers with permits to import. DDomestic • Areas U & V are deadweight losses. Consumers lose S + U + T + V in the form of higher prices and a reduction of consumer surplus. Quantity(peanuts) Qd1 Qd2 Q2 Q1
Arguments Used to Justify Trade Restrictions • Proponents of trade restrictions often use the following arguments in an effort to justify their position: • National defense argument:domestic industry is needed for national defense purposes. • Dumping:the sale of goods abroad at a price below the cost of production (and below the domestic market price of the exporting nation). • Dumping is illegal under U.S. law. • Infant Industry argument:new industry needs protection so it can mature.
A Few Additional IssuesRelated to Dumping • When considering the merits of anti-dumping restrictions, remember that: • Firms with large inventories (either domestic or abroad) may find it in their interest to offer goods at prices below their original cost of production. • Domestic firms are legally allowed to engage in this practice. • Lower prices benefit domestic consumers.
Trade Restrictions are a Special Interest Issue • “Protectionism is a politician's delight because it delivers visible benefits to the protected parties while imposing the costs as a hidden tax on the public.” —Murray L. Weidenbaum • The special interest effect provides the primary explanation for trade restrictions. • Trade restrictions almost always provide highly visible, concentrated benefits for a small group of people, while imposing widely dispersed costs that are often difficult to identify on the general citizenry. • Politicians have a strong incentive to favor special interest issues, even if they conflict with economic efficiency.
Trade Fallacies • Trade fallacies abound because people often fail to consider the secondary effects. • Key elements of international trade are often linked – you cannot change one element without changing the other. • This is the case with imports and exports; policies that restrain imports also restrain exports.
Trade Fallacies • Trade fallacy 1: “Trade restrictions that limit imports save jobs for Americans.” • This view is false because if foreigners sell less to us they will have fewer dollars with which to buy things from us. Thus, restraints on imports will also restrain exports. • Trade restrictions do not “save” jobs; they merely reshuffle them. Jobs “saved” in protected industries will be offset by jobs “lost” in export industries. • As the result of trade restrictions, fewer Americans are employed in areas where we have a comparative advantage.
Trade Fallacies • Trade fallacy 2: "Free trade with low-wage countries, such as Mexico and China, will reduce the wages of Americans." • Both high- and low-wage countries will gain when they are able to focus more of their resources on those productive activities that they do well. • The key to this issue is how will U.S. resources be used. If a low-wage country can supply a good cheaper than we can produce it, the U.S. can gain by purchasing the good from the low-wage country and using its resources to produce other goods for which it has a comparative advantage.
Economic Freedom as a Measure of Institutional Quality • Gains from trade, entrepreneurial discovery, and investment are largely dependent on institutions and policies supportive of voluntary exchange, market allocation, freedom to compete, and protection of people and their property from aggressors. • These ingredients comprise the foundation of economic freedom.
Growth rate Growth rate 1980-2005 1980-2005 10 Most Open Economies, 1980-2002 2005 GDPper capita Trade Openness, Income, and Growth TOI Hong Kong 10.0 $ 30,989 3.9 % Singapore 9.9 $ 26,390 4.3 % Bahrain 8.6 $ 19,112 1.0 % • The income levels and growth rates of the ten most and ten least open economies (as measured by the Trade Openness Index – TOI) are displayed here. • Note that more open economies both achieved higher income levels and grew more rapidly. Belgium 8.6 $ 28,575 1.7 % Malaysia 8.6 $ 9,681 3.6 % Luxembourg 8.5 $ 53,583 3.7 % Netherlands 8.4 $ 29,078 1.6 % Taiwan 8.4 $ 20,868 5.1 % Ireland 8.1 $ 34,256 4.5 % Australia 7.9 $ 29,981 1.9 % Average: 8.7 $28,251 3.1 % 10 Least OpenEconomies, 1980-2002 2005 GDPper capita TOI India 4.3 $ 3,072 4.0 % Tanzania 4.1 $ 662 2.3 % Egypt 4.1 $ 3,858 2.5 % Pakistan 3.9 $ 2,109 2.4 % Syria 3.8 $ 3,388 0.6 % Algeria 3.4 $ 6,283 0.5 % Sierra Leone 3.4 $ 717 - 1.1 % Burundi 3.0 $ 622 - 1.0 % Iran 2.9 $ 7,089 1.1 % Bangladesh 2.5 $ 1,827 2.2 % Average: 3.5 $ 2,963 1.4 % Sources: TOIdata are from Charles Skipton, The Measurement of Trade Openness. Doctoral Dissertation, Florida State University, 2003. Per capita GDP & growth data are from The World Bank, World Development Indicators, CD-ROM, 2004.
Trade Openness, Income, and Growth • Countries like Hong Kong and Singapore that have persistently followed more open trade policies, have achieved higher income levels, and grown more rapidly than more closed economies. • During the last two decades, trade restrictions have declined sharply, particularly in less developed economies. • Following the passage of NAFTA, U.S. trade with both Canada and Mexico grew rapidly. • The U.S. economy performed impressively, as the size of the trade sector grew during the 1990s.
U.S. Trade with Canada and Mexico U.S. Trade with Canada and Mexico, 1980-2012(Exports and Imports as a Share of GDP) • Measured as a share of GDP, U.S. trade with both Canada and Mexico has increased sharply as a result of NAFTA during the last 18 years. 5.0% 4.5% Canada 4.0% 3.5% 3.0% 2.5% 2.0% 1.5% Mexico 1.0% 0.5% 0 1980 1985 1990 1995 2000 2005 2010
Trade Openness, Income, and Growth • Today, less developed countries are often at the forefront of those pushing for greater trade openness, while high-income countries often impose restrictions in order to protect various domestic industrial interests and preserve their farm subsidy programs.
Questions for Thought: • “If the revenue collected by the government is taken into account, a tariff has no net impact on the welfare of a society.” -- Is this statement true? 2. Politicians have a strong incentive to support restrictions that limit international trade because (a) trade restrictions generally benefit all, or nearly all, voters. (b) trade restrictions generally provide highly visible, concentrated benefits for a relatively small number of people while imposing hard-to-identify-costs on others.
Questions for Thought: • The imposition of tariffs, quotas, & other trade barriers are often referred to as protectionist policies. Who is being protected? What are they being protected from? • “Exports are good. They create jobs and help make America prosperous. On the other hand, imports destroy jobs and reduce our standard of living.” Do you agree or disagree? • “Policies that reduce the volume of imports will also reduce the volume of exports.” -- Is this statement true? • Why would political officials want to prohibit their citizens from trading with foreigners?
Questions for Thought: 7. In 2002, the Bush administration imposed tariffs of up to 25% on imported steel products. This action (a)reduced the supply of steel in the domestic market and led to higher steel prices. (b)increased U.S. employment because it saved jobs in the steel industry. (c) reduced employment in the U.S. steel container industry because the higher steel prices made it more difficult for them to compete with foreign rivals. (d) helped George Bush carry the state of Ohio in the 2004 presidential election.
End of Chapter 18