Getting Data into R & Bioconductor
Aed í n Culhane aedin@jimmy.harvard.edu. Getting Data into R & Bioconductor. http://www.hsph.harvard.edu/research/aedin-culhane/. Simple Excel SpreadSheet data. Already described Read.table() Read.csv() scan() Are other formats eg netcdf However more datatype specialized.

Getting Data into R & Bioconductor
E N D
Presentation Transcript
Aedín Culhane aedin@jimmy.harvard.edu Getting Data into R & Bioconductor http://www.hsph.harvard.edu/research/aedin-culhane/
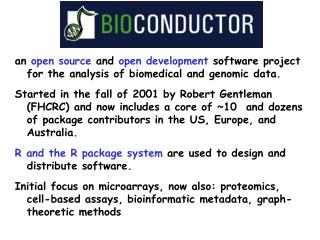
Simple Excel SpreadSheet data • Already described • Read.table() • Read.csv() • scan() • Are other formats eg netcdf • However more datatype specialized. • Look at Technologies on BiocViews. • http://www.bioconductor.org/packages/release/BiocViews.html
Some common data types Microarray SNP Increasingly NGS
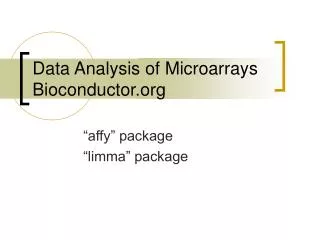
Reading Affymetrix Data library(affy) require(affy) # Alternative affybatch <- ReadAffy(celfile.path="[Location of your data]") eSet<-justRMA()
Public Microarray Data ArrayExpress 21997 Studies (622,617 profiles,) GEO 22,735 Studies (558,074 profiles) Statistics May 2011
>500,000 arrays x $500 = $250,000,000 Cancer Studies account for >14% of all studies in databases…
More on GEOquery require(GEOquery) Let's try to load the GDS810 dataset which contains data on Alzheimer's disease at various stages of severity. GDS810<-getGEO("GDS810") The getGEO function returns an object of class GEOData. You can get a description of this class like this: help("GEOData-class") Meta(GDS810) Columns(GDS810) head(Table(GDS810))
Other Arrays • Illumina • Lumi package • 2 color spotted arrays • Limma package • Other arrays • http://www.bioconductor.org/help/workflows/oligo-arrays/
Exercise From GEO bring down GSE Download the dataset GSE1297 using getGEO This data will be downloaded as an eSet, so to see the expression data and phenoData, use pData and exprs Use ArrayQualityMetrics to Assess the data quality of these data
With thanks to www.bioconductor.org/help/course.../Bioconductor-Introduction-lab.pdf
Quick Aside: Interpreting hierarchical clustering trees Hierarchical analysis results viewed using a dendrogram (tree) Distance between nodes (Scale) Ordering of nodes not important (like baby mobile) A B Tree A and B are equivalent