Download
1 / 46
460 likes | 567 Vues
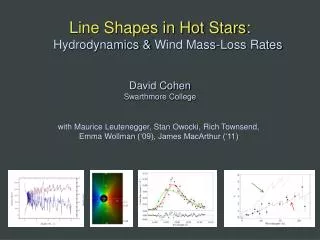
Line Shapes in Hot Stars : Hydrodynamics & Wind Mass-Loss Rates. David Cohen Swarthmore College. with Maurice Leutenegger , Stan Owocki , Rich Townsend, Emma Wollman (‘09), James MacArthur (‘11). Pup (O4 If). Capella (G5 III) – coronal source – for comparison. Pup. Ne X.

E N D
Line Shapes in Hot Stars: Hydrodynamics & Wind Mass-Loss Rates David CohenSwarthmore College with Maurice Leutenegger, Stan Owocki, Rich Townsend, Emma Wollman (‘09), James MacArthur (‘11)
Pup (O4 If) Capella(G5 III) – coronal source – for comparison
Pup Ne X Fe XVII Ne IX Capella
Pupmassive broad, skewed, blue shifted Capellalow mass unresolved
Vshock ~ 300 km/s : T ~ 106 K shock onset at r ~ 1.5 Rstar hot plasma has low density
99% of the wind mass is cold*, partially ionized…x-ray absorbing *typically 20,000 – 30,000 K; maybe better described as “warm”
photoelectric absorption:continuum opacity in the cold wind component CNO processed solar abundance
isovelocity contours -0.2vinf +0.2vinf -0.6vinf +0.6vinf -0.8vinf +0.8vinf observer on left
isovelocity contours -0.2vinf +0.2vinf -0.6vinf +0.6vinf -0.8vinf +0.8vinf observer on left t= 3 optical depth contours t= 1 t= 0.3
opacity of the cold windcomponent wind mass-loss rate wind terminal velocity radius of the star
=1 contours t=1,2,8 Ro=1.5 Ro=3 j ~ 2 for r/R* > Ro, = 0 otherwise Ro=10 key parameters: Ro &t*
We fit these x-ray line profile models to each line in the Chandra data Fe XVII Fe XVII
And find a best-fit t* and Ro… Fe XVII t* = 2.0 Ro = 1.5 Fe XVII
…and place confidence limits on these fitted parameter values 68, 90, 95% confidence limits
z Pup: three emission lines Mg Lya: 8.42 Å Ne Lya: 12.13 Å O Lya: 18.97 Å t* = 1 t* = 2 t* = 3 Recall:
atomic opacity of the wind CNOprocessed Solar
Fits to 16 lines in the Chandra spectrum of zPup t*(l) trend consistent with k(l)
Mbecomes the free parameter of the fit to the t*(l) trend t*(l) trend consistent with k(l)
Traditional mass-loss rate: 8.3 X 10⁻⁶Msun/yr Our best fit: 3.5 X 10⁻⁶Msun/yr
Traditional mass-loss rate: 8.3 X 10⁻⁶Msun/yr Fe XVII Our best fit: 3.5 X 10⁻⁶Msun/yr
Ori: O9.5 e Ori: B0
z Ori (09.7 I): O Lya 18.97 Å Ro = 1.6 R* t* = 0.3
t* quite low: is resonance scattering affecting this line? - Next talk, by M. Leutenegger Ro = 1.6 R* t* = 0.3
e Ori (B0 Ia): Ne Lya 12.13 Å Ro = 1.5 R* t* = 0.6
M-dot ~ 2 X 10⁻⁵ Msun/yr HD 93129Aab (O2.5): Mg XII Lya 8.42 Å Vinf ~ 3200 km/s M-dot ~ 5 X 10⁻⁶ Msun/yr Ro = 1.8 R* t* = 1.4
Multi-wavelength evidence for lower mass-loss rates is emerging
“Clumping” – or micro-clumping: affects density-squared diagnostics; independent of clump size, just depends on clump density contrast (or filling factor, f) visualization: R. Townsend
But porosity is associated with optically thick clumps, itacts to reduce the effective opacity of the wind; it does depend on the size scale of the clumps The key parameter is the porosity length, h = (L3/ℓ2) = ℓ/f ℓ L f = ℓ3/L3
Clump size increasing The porosity length, h: clump size h =ℓ/f Porosity length increasing clump filling factor (<1)
Porosity only affects line profiles if the porosity length (h) exceeds the stellar radius
The clumping in 2-D simulations (density shown below) is on quite small scales Dessart & Owocki 2003, A&A, 406, L1
No expectation of porosity from simulations Natural explanation of line profiles without invoking porosity Finally, to have porosity, you need clumping in the first place, and once you have clumping…you have your factor ~3 reduction in the mass-loss rate
No expectation of porosity from simulations Natural explanation of line profiles without invoking porosity Finally, to have porosity, you need clumping in the first place, and once you have clumping…you have your factor ~3 reduction in the mass-loss rate
No expectation of porosity from simulations Natural explanation of line profiles without invoking porosity Finally, to have porosity, you need clumping in the first place, and once you have clumping…you have your factor ~3 reduction in the mass-loss rate (for z Pup, anyway)
f ~ 0.1 is indicated by H-alpha, UV, radio free-free analysis f = 0.2 f = 0.05 f = 0.1
And lack of evidence for porosity…leads us to suggest visualization in upper left is closest to reality f = 0.2 f = 0.05 f = 0.1
conclusions Line widths consistent with embedded wind shocks Skewed line shapes consistent with photoelectric absorption; magnitude and wavelength trend enable a mass-loss rate measurement Consistent explanation for zeta Pup – M down by factor of 3, no need to invoke porosity
conclusions Line widths consistent with embedded wind shocks Skewed line shapes consistent with photoelectric absorption; magnitude and wavelength trend enable a mass-loss rate measurement Consistent explanation for zeta Pup – M down by factor of 3, no need to invoke porosity
conclusions Line widths consistent with embedded wind shocks Skewed line shapes consistent with photoelectric absorption; magnitude and wavelength trend enable a mass-loss rate measurement Consistent explanation for zeta Pup – M down by factor of 3, no need to invoke porosity
conclusions Line widths consistent with embedded wind shocks Skewed line shapes consistent with photoelectric absorption; magnitude and wavelength trend enable a mass-loss rate measurement Consistent explanation for zeta Pup – M down by factor of 3, no need to invoke porosity