Download
1 / 42
420 likes | 710 Vues
Medicare Hospital Value-Based Purchasing and Hospital Readmission Program Overview and Analysis . VHQC QualitySync II April 9, 2013. Todays Goals. Overview of the Value-Based Purchasing and Readmission Penalty Program Virginia specific data Identify top performers by category

E N D
Medicare Hospital Value-Based Purchasing and Hospital Readmission Program Overview and Analysis VHQC QualitySync II April 9, 2013
Todays Goals • Overview of the Value-Based Purchasing and Readmission Penalty Program • Virginia specific data • Identify top performers by category • Interactive discussion on what hospitals are doing to improve scores
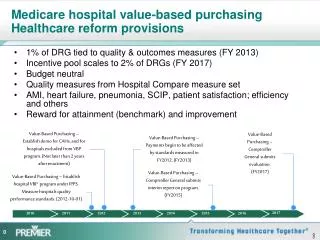
Key Points on VBP • CMS issued proposed VBP rule on January 7, 2011 • Final rule issued April 29, 2011 • VBP program is budget neutral, however approximately $964 million will be redistributed among hospitals in Federal FY 2013, which begins October 1, 2012 • VBP is funded by Medicare IPPS payment reductions of 1.0% in FFY 2013, 1.25% in 2014, 1.5% in 2015, 1.75% in 2016, and 2.0% for FFY 2017 and beyond • The payment adjustment applies to the base operating amount: excludes IME, DSH, low-volume adjustment and outliers.
Who Participates in the VBP Program Program applies to PPS hospitals except for: • Specialty hospitals (psychiatric, rehab, children’s, LTCH) • Hospitals cited for “immediate jeopardy” • Critical Access Hospitals • Hospitals with usable data for less than 4 of the 13 process measures ( must have at least 10 reported cases ) • Hospitals with usable data for less than 2 of the 3 outcome measures • Hospitals that do not have at least 100 HCAHPS surveys • Maryland Hospitals
VBP Program Quality Measures • For FFY 2013, CMS will assess hospitals on 20 total measures: • 12 Clinical process of care measures • 8 HCAHPS patient experience measures • For FFY 2014 CMS is adding additional measures: • Patient Outcomes – Mortality • Heart Attack, Heart Failure, Pneumonia • Proposed FFY 2015 • Efficiency – Medicare Spending Per Beneficiary (MSPB) • Measures must be on Hospital Compare for at least one year to be used in VBP program (MSPB added in April 2012)
HCAHPS – Patient Experience Measures • Modifications to HCAHPS on Hospital Compare: • “patient rooms and bathrooms always clean” and “areas around patient rooms quiet” were combined • “Would you recommend this hospital?” NOT included
2015 Outcome Measure AHRQ PSI-90 Lower ratios indicate better quality
FY 2015 : Medicare Spending Per Beneficiary • Medicare Spending Per Beneficiary • Claims-based measure that include risk-adjusted and price-standardized payments for all Part A and Part B services provided from 3 days prior to hospital admission through 30 days after the hospital discharge.
Data Collection Timelines – FFY 13 & 14 • FFY 2013 Program: • Process of Care and Patient Experience of Care Domains: • Baseline Period: July 1, 2009 - March 31, 2010 (9 months) • Performance Period: July 1, 2011 - March 31, 2012 (9 months) • FFY 2014 Program: • Process of Care and Patient Experience of Care Domains: • Baseline Period: April 1, 2010 - December 31, 2010 (9 months) • Performance Period: April 1, 2012 - December 31, 2012 (9 months) • Patient Outcomes Domain: • Baseline Period: July 1, 2009 - June 30, 2010 (12 months) • Performance Period: July 1, 2011 - June 30, 2012 (12 months) • The FFY 2014 performance period has ended !
Data Collection Timelines – FFY 2015 • FFY 2015 Program: • Process of Care and Patient Experience of Care Domains: • Baseline Period: January 1, 2011 - December 31, 2011 (12 months) • Performance Period: January 1, 2013 - December 31, 2013 (12 months) • Patient Outcomes Domain: • Baseline Period: • Mortality: October 1, 2010 – June 30, 2011 (9 months) • AHRQ PSI-90 Composite: October 15, 2010 – June 30, 2011 (9 months) • CLABSI: January 1, 2011 – December 31, 2011 (12 months) • Performance Period: • Mortality: October 1, 2012 – June 30, 2013 (9 months) • AHRQ PSI-90 Composite: October 15, 2012 – June 30, 2013 (9 months) • CLABSI: February 1, 2013 – December 31, 2013 (11 months)
Data Collection Timelines – FFY 2015 Cont. FFY 2015 Program (Cont): Efficiency: ( Medicare Spending Per Beneficiary) Baseline period: May 1, 2011 – December 31, 2011 ( 8 months) Performance Period: May 1, 2013 – December 31, 2013 (8 months)
VBP Domain Weighting for FYs 2013 through 2015 Virginia has done well on process scores, however the payout weight associated with this measure is decreasing each year.
What does VBP mean to Virginia hospitals? Based on the 2013 VBP scores: • Virginia’s average score is 51%, National average is 49 % • We rank 13th nationally in the overall VBP score and 10th in payment return • Virginia hospitals are estimated to receive a 4.9 % gain. • The estimated 1% withholding from Virginia hospitals is $21.7 Million • Virginia’s gain will be approximately $1.1 Million
What’s in store for 2014 ? Based on the estimated 2014 VBP scores: • Virginia’s average score is 41.5%, National average is 42.7 % • We rank 26th nationally in the overall VBP score and 21st in payment return • Virginia hospitals are estimated to lose (2.38%). • The estimated 1.25 % withholding from Virginia hospitals is $27.6 Million • Virginia’s estimated loss will be approximately ($658,000)
2014 Estimated Ranking Details • Virginia ranks 26th nationally in overall score • Process Measure scores, Virginia ranks 5th nationally • HCAHPS Scores, Virginia ranks 34th nationally • Outcomes scores, Virginia ranks 31th nationally • Virginia has 68 hospitals currently eligible to participate • 29 hospitals stand to gain money • 39 hospitals stand to lose money • Largest percent loss is a 50% return • Largest percent gain is a 140% return • Largest dollar loss is ($262,000) • Largest dollar gain is $303,000
HCAHPS Trends • Hospitals that performed poorly in one HCAHPS category usually performed low in multiple categories • Smaller hospitals tend to have higher HCAHPS scores • HCAHPS Weighting is remaining at 30 percent
How is Virginia doing with HCAHPS scores? Quarter is the data release date
Goals for Your Hospital and the State • Continue to improve on Process Measures • Virginia is doing well, however we must continue to improve as other facilities and states will improve on their scores • Commit to achieving top-tier performance • Improve on Outcomes Measures • The performance period for the Outcomes domain ends June 30, 2013 • Continue to work on reducing the mortality rate for future years
Goals for Your Hospital and the State • Significantly improve HCAHPS scores • This will require a change in culture for the patient, physicians and staff • Patient, physician and employee engagement are essential • Significant amount of compression – Can be doing reasonably well and receive no achievement points due to being below threshold and no improvement points due to relatively high scores already
Goals for Your Hospital and the State • Prepare for the Medicare Spending Per Beneficiary Measure • Based on the data release only 10 Virginia hospitals are over the 1.0 while 56 are below • Analyze your Hospital Specific Report issued by CMS in April which will provide opportunities for improvement. • Make sure that Physicians, Administration and Staff are all engaged to improve quality and efficiency. • Be proactive and know your numbers, if you wait for data to be released you will only have a short time to make changes. • Stay on top of any New Measures and you should have already started working on improving those scores
VBP Questions ? Score VBP
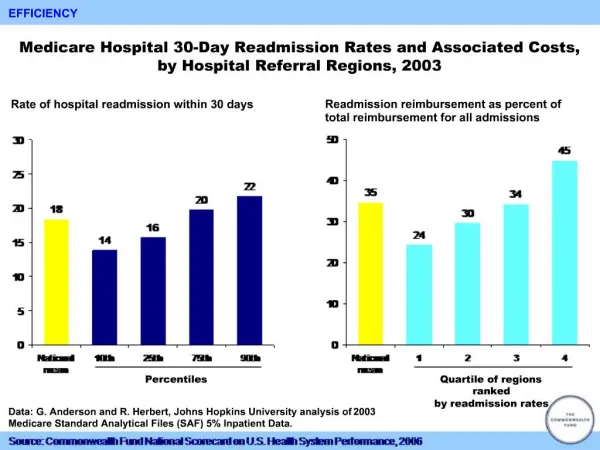
Hospital Readmission Program • This is a separate program from the Value-Based Purchasing Program • This is not a redistribution of funds, but a penalty program for having “excess” readmissions. • CMS is using the 30-day readmission measures for: • AMI – Acute Myocardial Infarction • HF – Heart Failure • PN – Pneumonia • The program began October 1, 2012 (FFY 2013) and is capped at 1.0 % reduction for FFY 2013. The reduction is 2 % in 2014 and 3 % for FFY 2015 and after.
Overview of the Readmission Program • 3 years of data – Discharges July 1, 2008 through June 30, 2011 for FFY 2013. • A readmission is defined as a second admission to the same or another acute care hospital within 30-days of the discharge from the initial hospital. • CMS did not adopt any additional exclusions nor any additional risk adjustment in determining the readmission rate for the measures beyond those under the IQR program.
Overview of the Readmission Program • CMS will compare a hospital’s risk-adjusted readmission rate to the expected readmission rate. If the ratio is greater than 1.0 the hospital will be subject to a payment penalty. • CMS expects about 65 % of hospitals to incur a penalty, with 8 % incurring the maximum 1 % penalty.
How Does Virginia Stack Up ? • National Numbers • Total Hospitals 3,448 • No Adjustment 1,234 • Full 1% Adjust 276 • % No adjustment 35.8 % • % Full 1% Adjust 8.0 % • Total Dollars to be withheld • $ 279 Million • Average % withheld .3 % • Virginia Numbers • Total Hospitals 79 • No Adjustment 20 • Full 1% Adjust 7 • % No adjustment 25.3 % • % Full 1% Adjust 8.9 % • Total Dollars to be withheld • $ 6.8 Million • Average % withheld .3 % • Largest Facility Impact • ($ 746,500)
Questions or Comments Jay Andrews jandrews@vhha.com (804) 965-1229