Chapter 9: Trace Elements
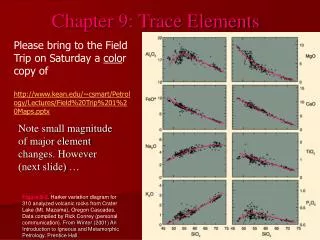
Chapter 9: Trace Elements. Please bring to the Field Trip on Saturday a colo r copy of http://www.kean.edu/~csmart/Petrology/Lectures/Field%20Trip%201%20Maps.pptx. Note small magnitude of major element changes. However (next slide) ….

Chapter 9: Trace Elements
E N D
Presentation Transcript
Chapter 9: Trace Elements Please bring to the Field Trip on Saturday a color copy of http://www.kean.edu/~csmart/Petrology/Lectures/Field%20Trip%201%20Maps.pptx Note small magnitude of major element changes. However (next slide) … Figure 8-2.Harker variation diagram for 310 analyzed volcanic rocks from Crater Lake (Mt. Mazama), Oregon Cascades. Data compiled by Rick Conrey (personal communication).From Winter (2001) An Introduction to Igneous and Metamorphic Petrology. Prentice Hall.
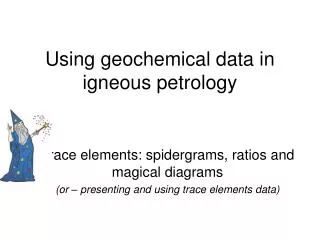
Transition Elements Transition elements often vary by > 103 wrt SiO2. Very useful since so sensitive to distribution & fractionation Zr, a transition element Incompatible HFSE See slide 43 Figure 9-1. Harker Diagram for Crater Lake. From data compiled by Rick Conrey. From Winter (2001) An Introduction to Igneous and Metamorphic Petrology. Prentice Hall.
Goldschmidt’s rules (simplistic, but useful) 1.2 ions with the same valence and radius should exchange easily and enter a solid solution in amounts equal to their overall proportions How does Rb+ behave? As K+, concentrated in K-spars, micas, and evolved melts Ni++ behaves as Mg++, concentrates in Olivine TAKE OUT YOUR COORDINATION NUMBERS AND IONIC RADII CHART
Rb+ [6] 1.57 Åfollows K+ [6] 1.46 Å & conc. in K-Spar, mica, & late melt. Ni++ [6] 0.77 Å follows Mg++ [6] 0.8 Å & conc in Mg-Olivine “Forsterite”
Goldschmidt’s rules • 2. If 2 ions have a similar radius and the same valence: the smaller ion is preferentially incorporated into the solid over the liquid Bounces off the rim less Smaller ion preferentially -> solid (Mg++ is smaller than Fe++ so more Mg++ in high temp Olivine than in melt) Fig. 6-10. Isobaric T-X phase diagram at atmospheric pressure After Bowen and Shairer (1932), Amer. J. Sci. 5th Ser., 24, 177-213. From Winter (2001) An Introduction to Igneous and Metamorphic Petrology. Prentice Hall.
1 Ångström = 1.0 × 10⁻¹⁰ meters • 3. If 2 ions have a similar radius, but different valence: the ion with the higher charge is preferentially incorporated into the solid over the liquid Rutile TiO2 versus Hematite Fe2O3 Example Ti+4 [6] r=0.69 Angstrom Other ions this size Fe +3 r=0.68 A Mn +3 [6] r=.70 A Ti+4 is always preferred in solids over liquids. Example Cr+3 [6] r=0.76 Other ions this size Ni +2 [6] r=0.77 A Fe +2 [6] r=.77 Cr+3 is always preferred in solids over liquids.
Anorthite higher T than Albite Forsterite higher T than Fayalite Chemical Fractionation • The uneven distribution of an ion between two competing (equilibrium) phases • Example: the ratio of Ca++/Na+ is always greater in plagioclase crystals than in the coexisting melt. Ca++ higher valance than Na+, goes into Plag xtals. first. • If melting Plag, Na+ goes to melt first. • Example: the ratio of Mg++/Fe++ is always greater in Olivine than in the coexisting melt.
If the reaction between solid and liquid phases is a phase change of some component i i(liquid)i(solid) Recall that we used the lever principle to estimate this ratio from our phase diagrams A distribution constant KDis Where Xi is the mole fraction of component i in some phase. KD the ratio of solubility of component i in these two phases.
Different units As long as the concentrations of the components are dilute, call KD the partition coefficient Where C is the concentration of a trace element in the phase indicated, solid and liquid, in ppm or wt% Table 9.1 (three slides below this) gives partition coefficients for commonly used trace elements in minerals precipitating from basaltic or andesitic melts.
Trace element activity varies in direct relation to their concentration in the system. • Thus if for Nickel XNi in the system doubles the XNi in all phases will double • This does not mean that XNi in all phases is the same, since trace elements do fractionate. Rather the XNi within each phase will vary in proportion to the system concentration • For example: suppose C(Ni) = 20 ppm in a system • C(Ni) in olivine may be 100 ppm • C(Ni) in plagioclase may be 1 ppm • C(Ni) in liquid may be 10 ppm • Double C(Ni) in system to 40 ppm: Ol -> 200 ppm, Plag -> 2 ppm and liquid -> 20 ppm
Incompatible elements concentrate in the melt KD « 1 much less than 1 Lesson: incompatibles don’t stick on crystal faces unless the Temps are low. Melt a xtal, incompatibles go to the melt. • Compatible elements concentrate in the solid KD» 1 much more than 1
Compatibility depends on minerals and melts involved. Which are incompatible? KD<< 1 , in liquid melt I marked some extreme examples
eq. 9-4: Di = WA Di WA = weight % of mineral A in the rock Di = partition coefficient of element i in mineral A A A • For a rock, determine the bulk distribution coefficient D for an element by calculating the contribution for each mineral
Garnet Lherzolite Mantle Xenolith (Garnet Lherzolite)Kimberley, SOUTH AFRICA Photographed by Tony Peterson
Example: hypothetical garnet lherzolite = 60% olivine, 25% orthopyroxene, 10% clinopyroxene, and 5% garnet (all by weight), using the data in Table 9-1, the bulk distribution coefficient D for Er is: DEr = (0.6 · 0.026) + (0.25 · 0.23) + (0.10 · 0.583) + (0.05 · 4.7) = 0.366 Er = Erbium http://earthref.org/KDD/e:68/
We mentioned earlier Transition elements often vary by > 103 wrt SiO2. Very useful since so sensitive to distribution & fractionation • Coef. D for Ni in Olivine in Tb 9-1 = 14>>1 The abrupt drop in Ni below 55% SiO2 indicates fractionation of Olivine there. At SiO2 > 55% another mineral or process is removing Ni Ni ppm Figure 9-1a. Ni Harker Diagram for Crater Lake. From data compiled by Rick Conrey. From Winter (2001) An Introduction to Igneous and Metamorphic Petrology. Prentice Hall.
Incompatible trace elements D<< 1 concentrate in the liquid until the melt cools, which is when it has more silica. So Trace Elements reflect the proportion of liquid at a given state of crystallization or melting Zr ppm Zr, a transition element Incompatible HFSE See slide 43 Figure 9-1b. Zr Harker Diagram for Crater Lake. From data compiled by Rick Conrey. From Winter (2001) An Introduction to Igneous and Metamorphic Petrology. Prentice Hall.
Trace element concentrations are in the Henry’s Law* region of concentration, so their activity varies in direct relation to their concentration in the system Thus if XNi in the system doubles the XNi in all phases will double Because of this, the ratios of trace elements are often superior to the concentration of a single element in identifying the role of a specific mineral * "At a constant temperature, the amount of a given gas that dissolves in a given type and volume of liquid is directly proportional to the partial pressure of that gas in equilibrium with that liquid."
K/Rb often used to measure the importance of amphibole in a source rock • K & Rb behave very similarly, so K/Rb should be ~ constant • If amphibole important, almost all K and Rb reside in it • Amphibole has a D of about 1.0 for K and 0.3 for Rb
Sr and Ba (also incompatible elements) • Sr is excluded from most common minerals except plagioclase • Ba similarly excluded except in alkali feldspar (Sanidine, Orthoclase, Microcline) • ratio Ba/Sr increases w plagioclase, decreases when orthoclase xtals present
Sc Scandium element 21 Compatible example: • Ni strongly fractionated (goes to solids) from olivines to pyroxenes • Cr and Sc pyroxenes > olivine • Ni/Cr or Ni/Sc can distinguish the effects of olivine and Augite in a partial melt or a suite of rocks produced by fractional crystallization
Models of Magma Evolution • Batch Melting • The melt remains in equilibrium with the solid until at some point it floats upward, separating from the solids
C 1 = L - + C Di (1 F) F O Models of Magma Evolution • Batch Melting (Shaw) • eq. 9-5 • CL = trace element concentration in the liquid • CO = trace element concentration in the original rock before melting began • F = wt fraction of melt produced = melt/(melt + rock) • Di = bulk distribution coefficient for element i
low D = incompatible low F little partial melting Batch Melting A plot of CL/CO vs. F for various values of Di using eq. 9-5 Unlikely F values • For Di = 1.0 there is (by definition) no fractionation, • concentration of element i • the same in solid and liquid no fractionation Figure 9-2. Variation in the relative concentration of a trace element in a liquid vs. source rock as a fiunction of D and the fraction melted, using equation (9-5) for equilibrium batch melting. From Winter (2001) An Introduction to Igneous and Metamorphic Petrology. Prentice Hall.
The concentration of the trace element in the liquid varies more as Di deviates from 1. • Especially true for low % melting (low F) and Di<< 1.0 (=incompatibleelement) Example: D near 0.001, and F near 0.02, CL/Co varies from 20 to 100 Figure 9-2. Variation in the relative concentration of a trace element in a liquid vs. source rock as a function of D and the fraction melted, using equation (9-5) for equilibrium batch melting. From Winter (2001) An Introduction to Igneous and Metamorphic Petrology. Prentice Hall.
Highly incompatible elements • Greatly concentrated in the initial small fraction of melt produced by partial melting • Subsequently diluted as F increases Find a small early partial melt, concentrated incompatibles there Incompatibles go to liquid Figure 9-2. Variation in the relative concentration of a trace element in a liquid vs. source rock as a fiunction of D and the fraction melted, using equation (9-5) for equilibrium batch melting. From Winter (2001) An Introduction to Igneous and Metamorphic Petrology. Prentice Hall.
As F 1, everything is melted, so the concentration of every trace element in the liquid => the source rock (CL/CO 1) As F 1 CL/CO 1 1 C L = - + C Di (1 F) F O Di the bulk distribution coefficient Figure 9-2. Variation in the relative concentration of a trace element in a liquid vs. source rock as a fiunction of D and the fraction melted, using equation (9-5) for equilibrium batch melting. From Winter (2001) An Introduction to Igneous and Metamorphic Petrology. Prentice Hall.
1 C L = - + C Di (1 F) F O Recall then: Di the bulk distribution coefficient As F 0 CL/CO 1/Di If we know the concentration of a trace element in a magma CL , derived by a small degree of batch melting, and we know Di we can estimate the concentration of that element in the source region (CO). This tells us which area was the source. Figure 9-2. Variation in the relative concentration of a trace element in a liquid vs. source rock as a fiunction of D and the fraction melted, using equation (9-5) for equilibrium batch melting. From Winter (2001) An Introduction to Igneous and Metamorphic Petrology. Prentice Hall.
C 1 = L C F 1 C O L = - + C Di (1 F) F O Di the bulk distribution coefficient • For very incompatible elements as Di 0 equation 9-5 reduces to: eq. 9-7 If we know the concentration of a very incompatible element in both a magma and the source rock, we can determine the fraction of partial melt produced
Table 9-2 . Conversion from mode to weight percent Mineral Mode Density Wt prop Wt% ol 15 3.6 54 0.18 cpx 33 3.4 112.2 0.37 plag 51 2.7 137.7 0.45 Sum 303.9 1.00 Worked Example of Batch Melting: Rb and Sr Basalt with the “mode” = Volume% [cm3]: 1. Convert to weight % minerals (WolWcpx etc.) Done, see rightmost column above. 15 cm3 x 3.6g/ cm3 = 54g 54g/303.9g ~ 0.18 so Wol ~ 0.18
A Basalt (ol, cpx, plag) with the mode: 1. Convert to weight % minerals (WolWcpxWplag) (previous slide) 2. Use equation eq. 9-4: Di = WA Di and the table of D (Table 9.1) values for Rb and Sr in each mineral to calculate the bulk distribution coefficients: DRb = 0.045 (Rb incompatible) and DSr = 0.848 (close to 1) Worked Example of Batch Melting: Rb and Sr Table 9-2 . Conversion from mode to weight percent Mineral Mode Density Wt prop Wt% ol 15 3.6 54 0.18 cpx 33 3.4 112.2 0.37 plag 51 2.7 137.7 0.45 Sum 303.9 1.00 DRb = 0.01 x 0.18 + 0.031 x 0.37 + 0.071 x 0.45 = 0.045
3. Use the batch melting equation to calculate CL/CO for various values of F For F =0.05 and for Rb: CL/Co = 1/ ((0.045(1-0.05)) +0.05) = 10.78 Similarly for F = 0.05 and Sr CL/Co = 1.18 Then the ratio Rb/Sr = 10.78/1.18 = 9.12 Continue with remaining F From Winter (2010) 2nd edition An Introduction to Igneous and Metamorphic Petrology. Prentice Hall.
4. Plot CL/CO vs. F for each element Rubidium incompatible strongly partitions i.e. strongly concentrated in the early small melt Sr doesn’t change much, so Rb/Sr is approximately the Rb value Figure 9-3. Change in the concentration of Rb and Sr in the melt derived by progressive batch melting of a basaltic rock consisting of plagioclase, augite, and olivine. From Winter (2001) An Introduction to Igneous and Metamorphic Petrology. Prentice Hall.
Discussion • Any ratio of Incompatible to Compatible elements will be sensitive to the degree of partial melting in initial stages • Our experience with Ternary systems tells us it is unrealistic to expect a ratio of the minerals in the solid residues to remain constant. • What should we do?
Incremental Batch Melting • Calculate batch melting for successive batches (same equation) • Must recalculate Di as solids change and minerals are selectively melted • Figure 9-2 and 9-3 (earlier slides) show that the model we just used is most sensitive to Di at low values of F, so it is most important to use small increments in that area. Once F > 0.4, batch melts vary less and are less likely anyway.
Crystallization Extremes Either: Crystals remain in equilibrium with each melt increment OR The other extreme: separation of each crystal as it formed = perfectly continuous fractional crystallization in a magma chamber
Rayleigh fractional crystallization The second extreme: separation of each crystal as it formed = perfectly continuous fractional crystallization in a magma chamber Crystals accumulate on floor of magma chamber, isolating formed crystals • Concentration of some element in the residual liquid, CL is modeled by the Rayleigh equation: • eq. 9-8 CL/CO = F (Di -1) • Co conc. of element in original melt • F fraction of melt remaining after xtals removed
Other models are used to analyze • Mixing of magmas • Wall-rock assimilation • Zone refining • Combinations of processes End of Part 1
The Rare Earth Elements (REE) Begins Part 2
REEs • Group IIIA, +3 oxidation state, ionic radius decreases with increasing atomic number (the “Lanthanide contraction”) so right side smaller ions, fit more readily, more compatible. bigger smaller
Density Groups of REEs • LREE = light rare earth elements (Sc, La, Ce, Pr, Nd, Pm, Sm, Eu, and Gd; also known as the cerium group) • HREE = heavy rare earth elements (Y, Tb, Dy, Ho, Er, Tm, Yb, and Lu; also known as the yttrium group) • The densities of the LREEs (as pure elements) range from 2.989 (scandium) to 7.9 g/cc (gadolinium), while those of the HREEs are from 8.2 to 9.8, except for yttrium (4.47) and ytterbium (between 6.9 and 7) The latter are groups with the HREE due to similar geological behavior.
Oxygen Fugacity • Fugacity is the partial pressure of a gas phase which takes into account that the gas is able to chemically react with other components in the system. A measure of departure from Ideal Gas behavior. • Oxygen fugacity is the measure of the availability of oxygen (within a given system) to partake in chemical reactions. It represents the chemical potential of oxygen. It is also a way to quantify the redox state of a given system.This is very important in terms of determining the stable mineral present in a given geological system.More oxidizing conditions, in igneous or hydrothermal systems for example, favor the crystallization (and stability) of the more oxidized mineral phases.More available oxygen in the system = more oxidizing • System precipitates components with more oxygen (i.e. Hematite Fe2O3 (ratio 3/2 = 1.5) would crystallize, rather than Magnetite Fe3O4 (ratio 4/3 = 1.333).
Incompatible elements • An element unsuitable in size and/or charge to the cation sites of the rock forming minerals. The partition coefficient for them between rock-forming minerals and melt is much smaller than 1. • During the partial melting of the Earth's mantle and crust, elements that have difficulty in entering cation sites of the basaltic minerals (Olivine, Clinopyroxenes, Ca-rich Plagioclases) are concentrated in the liquid phase of the magma. They are destined for later minerals and glasses. For example, Potassium K enters the K-spars: Sanidine, Orthoclase, Microcline very late in fractionation. • Two groups of incompatible elements are known by acronyms. One group includes elements having large ionic radius, (called LILE, or large-ion lithophile elements. This LILE group includes potassium, rubidium, cesium, strontium, and barium. • The other group includes elements of large ionic valences (or high charges), such as zirconium Zr+4 , niobium, hafnium, rare earth elements (REE), thorium, uranium and tantalum (called HFSE, or high field strength elements). These can occur in pegmatites, for example the alkaline pegmatites we will see at Cranberry Lake.
Europium • Note: at low Oxygen fugacity, Europium can have a +2 valence, and Eu+2 can be more abundant than Eu+3 Eu+2 is a Large Ion Lithophile (LIL) Eu+3 is a high field strength (HFS) element. LILs include K, Rb, Cs, Ba, Pb+2 , Sr and Eu+2 LIL’s are low field strength, e.g. Potassium’s ion is K+, and are generally more mobile if a fluid is adjacent.
The term LILE is restricted to lithophile trace elements having a large ionic radius to charge ratio; that have ionic radii greater than those of Ca2+ and Na1+, some of the largest cations common to rock forming minerals. By this definition, LILEs are K, Rb, Cs, Sr, Ba, Pb and Eu+2
Oddo-Harkins Rule: atoms with even atomic numbers are more stable, and thus more abundant, than their odd-numbered neighbors: elements with odd atomic numbers have one unpaired proton and are more likely to capture another • Eliminate Oddo-Harkins effect and make y-scale more functional by normalizing to a standard • estimates of primordial mantle REE • chondrite meteorite concentrations
Europium anomaly • A negative dip is evidence liquid was in equilibrium with now-absent plagioclase*, which captured Eu+2 * It floated away Figure 9-5. REE diagram for 10% batch melting of a hypothetical lherzolite with 20% plagioclase, resulting in a pronounced negative Europium anomaly. From Winter (2001) An Introduction to Igneous and Metamorphic Petrology. Prentice Hall.
Application of Trace Elements to Igneous Systems 1. Use like major elements on variation diagrams to document fractionation, assimilation, etc. in a suite of rocks • TE more sensitive larger variations as process continues Figure 9-1a. Ni Harker Diagram for Crater Lake. From data compiled by Rick Conrey. From Winter (2001) An Introduction to Igneous and Metamorphic Petrology. Prentice Hall.
Application of Trace Elements to Igneous Systems 2. Identification of the source rock or a particular mineral involved in either partial melting or fractional crystallization processes Example: can use REE to distinguish between high pressure and low pressure sources of a mantle-derived magma In the deep continental crust, and at depths over about 100 km in the mantle, garnet and clinopyroxene are important phases, which remain as residual solids during the generation of up to 15-20% partial melting
Garnet concentrates the HREE and fractionates among them Thus if Garnet is in equilibrium with the partial melt (a residual phase in the source left behind) expect a concentration of Tb, Er, Yb, and Lu in the Garnet Shallow (< 40 km) partial melting of the mantle will have plagioclase in the residuum and a Eu anomaly will result