Optimal Policy and Value Functions in Modified Rat-Maze Problem
Explore dynamic programming and Monte Carlo methods for policy updates in an 8-state, 11-action rat-maze problem. Evaluate optimal actions, values, and policy convergence.

Optimal Policy and Value Functions in Modified Rat-Maze Problem
E N D
Presentation Transcript
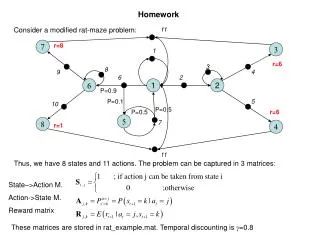
11 7 r=8 3 1 r=6 3 8 9 4 6 2 6 1 2 P=0.9 P=0.1 5 10 P=0.5 P=0.5 r=6 5 8 7 r=1 4 11 Homework Consider a modified rat-maze problem: Thus, we have 8 states and 11 actions. The problem can be captured in 3 matrices: State–>Action M. Action->State M. Reward matrix These matrices are stored in rat_example.mat. Temporal discounting is g=0.8
Homework • What is the optimal policy? What is the optimal value function? What is the optimal action-value function? • Program a dynamic programming algorithm with a greedy policy update. Start from an uninformed policy (all possible actions are equally likely). How fast does the algorithm converge to the optimal policy? • Program a Monte Carlo evaluation algorithm (use 50 iterations for one estimation step). Start at a naïve strategy, that is, each possible action is equi-probable. Evaluate after 50 steps and update your policy using a greedy, a sub-greedy and a softmax-algorithm. Let them run for 10 policy-iteration cycles. Try each policy-update rule 100 times. Plot the average return for each cycle. Which one gives the highest expected Return over the first 10*50 steps? Compare to the optimal policy. How often does each policy decide to go left vs. right on the first step? • BONUS: I have a policy-update rule that, starting from a naïve state in the above framework has a expected return for 50 steps (averaged over the first 500 steps) of 106.65. Optimal is 120.43. • Can you beat my policy-update rule?