Download

1 / 49
510 likes | 563 Vues
Explore powerful tools like BioPortal and BioJake to analyze, model, and visualize molecular biology data, facilitating drug design and research. Benefit from user-friendly interfaces and seamless integration functionalities. Enhance your biological research capabilities today!

E N D
GenBank Growth Chart Bases Year
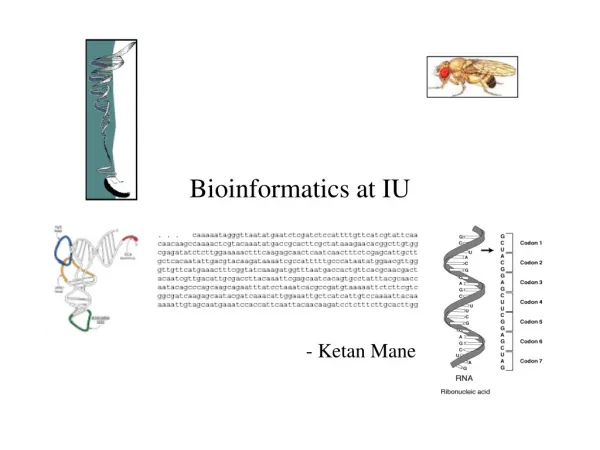
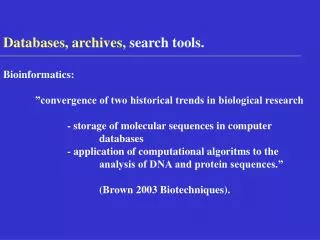
Use of Computers in Molecular Biology • Powerful tools for organise the data itself. • Exponential growth. • A new release is made every two months. • Data Analysis. • Retrieval. • Homology Search. • Modelling purposes - Drug Design • Data Integration • Data Visualisation
BioInformatics Tools at NUS • BioPortal • BioKris (formerly called BioKleisli) • BioWebWatch (Bio-Eyes) • BioJake • Other projects
BioPortal User friendly gateways to GCG and other software.
Prior Scenario Command line interface. • Basic OS knowledge. • User Interface(UI) for each program. • Platform dependent. Transient phase • Hyper text Menu Based Interface
Present Scenario • User-Friendly web interface to Biosoftware. • Platform Independent. • Depends on Client - Server Technology. • Common Gateway Interface (CGI) programs written in PERL and C.
Programs available • GCG • PHYLIP • CLUSTALW • GNUPLOT • SIGNALSCAN • LOCAL • ALIGN • TULLA
The web interface allows you to focus on • "How will I solve my sequence analysis problems?" • rather than on • "How do I use this software?"
Special features User Friendly Interface • The form based approach simplifies the task. • It guides you through the whole program. • No need to install and learn command line interface of all software. Format Independent Hyperlinks for Results
Special features Online Help • Speeds up your data entry and analysis. ConduitOutput can be piped to other programs for further analysis. Pileup Distances Growtree.
Special features • Temp file usage:(a) Output of other programs is input for them. (b) Programs which take a lot of time. • Improved Operation Control:A fully customisable interface provides a flexible environment. • Shared Access:This interface allows several distant users to use the same program simultaneously. • Remote retrieval and analysis:This interface allows you to access your program from anywhere in the world.
Special features of JAVA ver. Navigation Panel : Java navigation allows to view the tree structure for the programs. File handling Capability: Local desk top file loading.
BioKleisli or BioKris
Introduction • A BIC-KRDL collaboration • Open query system for broad-scale integration of heterogeneous distributed databanks • Flexible access for existing biological databanks
Features and Benefits • Features • Provides a query system that can integrate all types of biology databanks and analysis software • express high level views and transformations that go beyond flat tables • Flexible access = migrate + integrate + restructure • Benefits • More effective and easier access to world wide data for biologists • Enhances productivity and simplifies programming tasks
BioWebWatch or Bio-Eyes
Problems • Too much Information? • Many sites to cover despite automatic notification. • Revisit your site of interest at least once a month.
BioWebWatch • Allows users to automate queries. • Channels. • Users • Keywords • Websites
Goals • Collecting, aggregating, managing and integrating information. • Integration with existing software tools. • Sharing information across the organisation. • Collaboration with other information servers.
What’s out there? • Electronic Journals • Web Pages • News Groups • Databases
Cyberspace is a big place New Query Useless Hits Search GoodHits!
An Information Butler Automated Query Search Useless Hits Results Good Hits! Automated Dispersal Information Management
Creating a Query • Enter search string • Choose source • Preview search • Create Channel
BioJAKE • BioJAKE is a graphical program allowing for the onscreen creation, manipulation and visualization of metabolic pathways. • Pathways are represented as a series of molecules (images) linked together by a series of reactions (lines). • Each molecule is defined through it’s image, name, type and states.