Graphs, Networks, Trees: Examples and Visual Representation
1.02k likes | 1.14k Vues
Explore graphs, networks, and trees with examples and visual representations. Learn about the different ways these terms are used and understand the concepts with interactive tools and resources.

Graphs, Networks, Trees: Examples and Visual Representation
E N D
Presentation Transcript
Examples for in class • Visual Web • Website as graphs • See Brad’s http://www.aharef.info/static/htmlgraph/?url=http://www.ils.unc.edu/bmh/ • Touchgraph does websites, click on demos, then enter your home URL under Google box. • BlogWorld (interactive hyperbolic tree) • Viszter
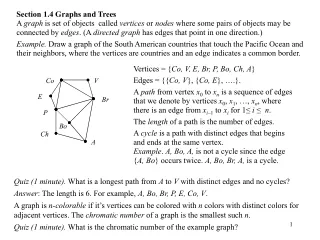
Graphs, Networks, Trees • The two terms "graph" and "network" are both used in several different ways. Following Dave Winer, the term "graph" is used to refer to (amongst other things): • a visual representation of the variation of one variable in comparison with that of one or more other variables • a mathematical concept of a set of nodes connected by links called edges • a data structure based on that mathematical concept • The term "network" is also used in several ways, including: • an interconnected system of things (inanimate objects or people) • a specialized type of graph (the mathematical concept) • Trees are subsets of graphs/networks.
Trees are Limited Version of Graphs • Subcaseof general graph • No cycles • Typically directed edges • Special designated root vertex
Tree Hierarchies in the World • Pervasive • Family histories, ancestries • File/directory systems on computers • Organization charts • Animal kingdom: Phylum,…, genus,… • Object-oriented software classes • ...
Trees • Hierarchies often represented as trees • Directed, acyclic graph • Two main representation schemes • Node-link • Space-filling
Node-Link Diagrams • Root at top, leaves at bottom is very common
Sample Representation From: Johnson & Shneiderman, ‘91
Examples • Good for • Search • Bad for • Understanding • Structure
Why Put Root at Top? • Root can be at center with levels growing outward too • Can any node be the root?
Drawing a Tree • How does one draw this? • DFS • Percolate requirements upward
Potential Problems • For top-down, width of fan-out uses up horizontal real estate very quickly • At level n, there are 2n nodes • Tree might grow a lot along one particular branch • Hard to draw it well in view without knowing how it will branch
InfoVis Solutions • Techniques developed in Information Visualization largely try to assist the problems identified in the last slide • Alternatively, Information Visualization techniques attempt to • show more attributes of data cases in hierarchy • or focus on particular applications of trees
SpaceTree • Uses conventional 2D layout techniques with some clever additions Grosjean, Plaisant, Bederson InfoVis‘02
Characteristics • Vertical or horizontal • Subtrees are triangles • Size indicates depth • Shading indicates number of nodes inside • Navigate by clicking on nodes • Strongly restrict zooming
Design Features • Make labels readable • Maximize number of levels opened • Decompose tree animation • Use landmarks • Use overview and dynamic filtering
3D Approaches • Add a third dimension into which layout can go • Compromise of top-down and centered techniques mentioned earlier • Children of a node are laid out in a cylinder “below” the parent • Siblings live in one of the 2D planes
Cone Trees • Developed at Xerox PARC • 3D views of hierarchies such as file systems Robertson, Mackinlay, Card CHI ‘91
Cone Trees Positive Negative • More space available to lay out tree • Aesthetically pleasing (?) • As in all 3D, occlusion obscures some nodes • Is it really more efficient? For what tasks/users/contexts?
Hyperbolic Browser • Focus + Context Technique • Detailed view blended with a global view • First lay out the hierarchy on the hyperbolic plane • Then map this plane to a disk • Start with the tree’s root at the center • Use animation to navigate along this representation of the plane Lamping and Rao, JVLC ‘96
2D Hyperbolic Browser • Approach: Lay out the hierarchy on the hyperbolic plane and map this plane onto a display region. • Comparison • A standard 2D browser • 100 nodes (w/3 character text strings) • Hyperbolic browser • 1000 nodes, about 50 nearest the focus can show from 3 to dozens of characters
Clicking on the blue node brings it into focus at the center
Key Attributes • Natural magnification (fisheye) in center • Layout depends only on 2-3 generations from current node • Smooth animation for change in focus • Don’t draw objects when far enough from root (simplify rendering)
Problems • Orientation • Watching the view can be disorienting • When a node is moved, its children don’t keep their relative orientation to it as in Euclidean plane, they rotate • Not as symmetric and regular as Euclidean techniques, two important attributes in aesthetics
How about 3D? • Can same hyperbolic transformation be applied, but now use 3D space? Munzner, IEEE CG&A ‘98
Performance • Handle much larger graphs, i.e. >100,000 edges • Support dynamic exploration & interactive browsing • Maintain a guaranteed frame rate
Old School • After all the interest in 3D and hyperbolic techniques in the ’90’s, recently, there has been renewed interest in the old 2D methods (just done better) • SpaceTree presented earlier • Next 3 papers…
Degree-of-Interest Trees • Problem • Trees quickly degrade into line • Approach • Use fisheye-like focus & context ideas to control how a tree is drawn
Approach • Combine multiple ideas • Expanded DOI computation • Logical filtering to elide nodes • Geometric scaling • Semantic scaling • Clustered representation of large unexpended branches • Animated transition
Compression • For nodes: compress to fit (compress in X or in Y) • Within-node compression • Data deletion • Word abbreviation • Node rotation
FlexTree • Horizontally-drawn tree with compression along vertical dimension • One focus is on showing decision trees well • Contextual multi-foci view • Basic idea: Push all nodes down as far as you can Song, Curran & Sterritt Information Visualization ‘04
Node-link Shortcomings • Difficult to encode more variables of data cases (nodes) • Shape • Color • Size • …but all quickly clash with basic node-link structure
Space-Filling Representations • Each item occupies an area • Children are “contained” under parent
Treemap • Space-filling representation developed by Shneiderman and Johnson, Vis ‘91 • Children are drawn inside their parent • Alternate horizontal and vertical slicing at each successive level • Use area to encode other variable of data items
Treemap? http://blog.wired.com/wiredscience/2008/06/awesome-infogra.html
Treemap Affordances • Good representation of two attributes beyond node-link: color and area • Not as good at representing structure • What happens if it’s a perfectly balanced tree of items all the same size? • Also can get long-thin aspect ratios • Borders help on smaller trees, but take up too much area on large, deep ones
A Good Use of TreeMaps and Interactivity www.smartmoney.com/marketmap
News Stories http://newsmap.jp/