Download
1 / 5
50 likes | 195 Vues
The Green Line of Sustainability. “The green line of sustainability” is the threshold of economic compliance with international human rights laws.

E N D
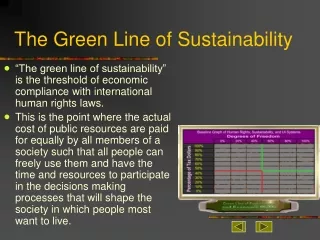
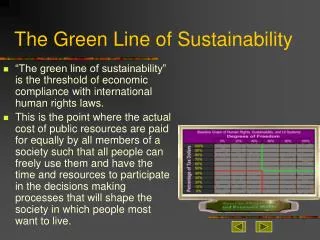
The Green Line of Sustainability • “The green line of sustainability” is the threshold of economic compliance with international human rights laws. • This is the point where the actual cost of public resources are paid for equally by all members of a society such that all people can freely use them and have the time and resources to participate in the decisions making processes that will shape the society in which people most want to live.
The Green Line of Sustainability: Columns and the Vertical Axis • The columns going from left to right represent degrees of human rights freedom. The green vertical line, and to its right, represent the degrees of democratic freedom necessary for people as individuals to effectively engage in the decision making processes that will effect their lives and determine the society in which they most want to live. • The columns left of the green vertical line represent the degrees that others can control one’s decision making against one’s will, thereby, violating one’s right of “self-determination”.
The Green Line Of Sustainability:Rows and the Horizontal Axis • The rows, from bottom to top are the percentages of one’s income or resources that are required to pay for the maintenance of public domain assets. • Below the horizontal red or green line, those with more wealth are increasingly subsidised for the use of resources by those with less wealth/income the further down in percentage one goes. (See tax slide show). • Above the central horizontal line are the degrees that public assets are improved, developed, and free for everyone.
The Green Line Of Sustainability • All that is within the upper right hand rectangle circumscribing the pink arrow, including the green line itself, is within the field of sustainability and human rights compliance. • The central horizontal line, that is being arbitrarily used as a baseline is founded loosely on the UUI 48% tax rate proposal. • Using that as a basis, it can be seen that all of our political parties, based on their tax rate proposals, fall presently within the “unsustainable ultra right wing lower red rectangle” in varying degrees. • The R,C, L, in the green sustainability rectangle are where right,central and left-winged politics would be if we were compliant with human rights standards. • Note, the money generated does not have to all come from income tax. There are other forms of funding such as transactional, unearned income, and inheritance taxes that are equally valid and would change the percentages. We can also lower costs through improved efficiency.
The Green Line OfSustainability: A Conclusion • This model provides a means to evaluate the various political parties in terms of actual “left/right politics” and their ability to meet basic human rights law standards. • At present the green line, representing current human rights law and centre politics at a global level, is viewed as ultra left by all of NZ’s political parties. Once this law is honoured all politics will take place within the upper green rectangle. The green line representing the baseline. Right-wing political parties will be directly on the line saying; “These many rights and no more” left wing political parties will move diagonally towards the upper corner saying “lets spend more and expand the quality of our health system” for example. Centre politics will then lie somewhere between them holding the balance. The “R”, “C”,”L” respectively from the previous chart. • The actual percentage costs are illustrative only, there are many variables that can adjust the costs in real terms. This is only a reference guideline. Note, higher taxes does not mean lower income (see tax slide show). • It can aid in evaluating how to maximise one’s energy effectively in the national political arena to promote human rights and environmental sustainability. • And to understand how universal income systems act as a baseline for sustainability. [Research model and slide presentation Copywrite C.E.R.E.S. 2000 for UIT].