Download
1 / 4
40 likes | 507 Vues
Air pollution that refers to the contamination of the air, irrespective of indoors or outside. A physical, biological or chemical alteration to the air in the atmosphere can be termed as pollution. It occurs when any harmful gases, dust, smoke enters into the atmosphere and makes it difficult for plants, animals, and humans to survive as the air becomes dirty. Proposed system considers pollution due to automobiles and provide a real time solution which is not just monitors pollution levels but also take into consideration control measures for reducing traffic and industrial zone in highly polluted areas. The solution is provided by a sensor based hardware module which can be placed along roads and plants. These modules can be placed on lamp posts and they transfer information about air quality wirelessly to cloud server. The proposed system also provides about air quality information through a mobile application which enables commuters to take up routes where air quality is good. Soe Soe Mon | Thida Soe | Khin Aye Thu "Air Quality Monitoring and Control System in IoT" Published in International Journal of Trend in Scientific Research and Development (ijtsrd), ISSN: 2456-6470, Volume-3 | Issue-5 , August 2019, URL: https://www.ijtsrd.com/papers/ijtsrd26554.pdf Paper URL: https://www.ijtsrd.com/computer-science/embedded-system/26554/air-quality-monitoring-and-control-system-in-iot/soe-soe-mon<br>

E N D
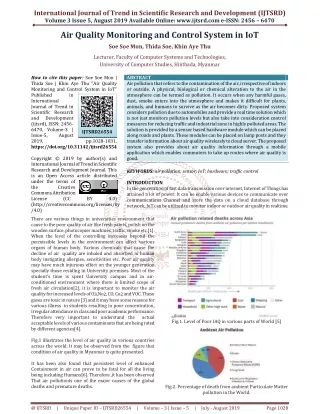
International Journal of Trend in Scientific Research and Development (IJTSRD) Volume 3 Issue 5, August 2019 Available Online: www.ijtsrd.com e-ISSN: 2456 – 6470 Air Quality Monitoring and Control System in IoT Soe Soe Mon, Thida Soe, Khin Aye Thu Lecturer, Faculty of Computer Systems and Technologies, University of Computer Studies, Hinthada, Myanmar How to cite this paper: Soe Soe Mon | Thida Soe | Khin Aye Thu "Air Quality Monitoring and Control System in IoT" Published in International Journal of Trend in Scientific Research and Development (ijtsrd), ISSN: 2456- 6470, Volume-3 | Issue-5, August 2019, https://doi.org/10.31142/ijtsrd26554 Copyright © 2019 by author(s) and International Journal of Trend in Scientific Research and Development Journal. This is an Open Access article distributed under the terms of the Creative Commons Attribution License (CC (http://creativecommons.org/licenses/by /4.0) There are various things in universities environment that cause to the poor quality of air like fresh paints, polish on the wooden surface, photocopier machines, traffic, smoke etc.[1]. When the level of the controlling increases beyond the permissible levels in the environment can affect various organs of human body. Various chemicals that cause the decline of air quality are inhaled and absorbed in human body instigating allergies, sensitivities etc. Poor air quality may have much injurious effect on the younger generation specially those residing in University premises. Most of the student’s time is spent University campus and in air- conditioned environment where there is limited scope of fresh air circulation[2], it is important to monitor the air quality for increased levels of O3,No2, CO, Co2 and VOC. These gases are toxic in nature [3] and it may have some reasons for various illness in students resulting in poor concentration, irregular attendance in class and poor academic performance. Therefore very important to understand the actual acceptable levels of various contaminants that are being rated by different agencies[4]. Fig.1 illustrates the level of air quality in various countries across the world. It may be observed from the figure that condition of air quality in Myanmar is quite presented. It has been also found that persistent level of enhanced Containment in air can prove to be fatal for all the living being including Humans[6]. Therefore ,it has been observed That air pollutionis one of the major causes of the global deaths and premature deaths. ABSTRACT Air pollution that refers to the contamination of the air, irrespective of indoors or outside. A physical, biological or chemical alteration to the air in the atmosphere can be termed as pollution. It occurs when any harmful gases, dust, smoke enters into the atmosphere and makes it difficult for plants, animals, and humans to survive as the air becomes dirty. Proposed system considers pollution due to automobiles and provide a real time solution which is not just monitors pollution levels but also take into consideration control measures for reducing traffic and industrial zone in highly polluted areas. The solution is provided by a sensor based hardware module which can be placed along roads and plants. These modules can be placed on lamp posts and they transfer information about air quality wirelessly to cloud server. The proposed system also provides about air quality information through a mobile application which enables commuters to take up routes where air quality is good. KEYWORDS: air pollution; sensor; IoT; hardware; traffic control INTRODUCTION In the genreration of fast data transmission over internet, Internet of Things has attained a lot of power. It can be enable various devices to communicate over communications Channel and store the data on a cloud database through network. IoT can be utilized to monitor indoor or outdoor air quality in realtime. IJTSRD26554 pp.1028-1031, BY 4.0) Fig.1. Level of Poor IAQ in various parts of World [5] Fig.2. Percentage of death from ambient Particulate Matter pollution in the World. @ IJTSRD | Unique Paper ID – IJTSRD26554 | Volume – 3 | Issue – 5 | July - August 2019 Page 1028
International Journal of Trend in Scientific Research and Development (IJTSRD) @ www.ijtsrd.com eISSN: 2456-6470 Related work IoT based air quality monitoring system has collected a lot of attention and various researchers have developed different microcontroller-based arrangement variation of CO and CO2 concentration in indoor environment has been investigated in detail by Kiuriski et al [10]. The study concludes the level of these two gases increases to a peak value at certain times in a day and proper ventilation could help in reducing the harmful effect of these gases within the confined environment. Fioccola et al [11] built a system based on Arduino board. Although the system used cloud platform, however, the presented system is not wireless. Further in the readings obtained from sensor are not stored locally hence in case of interruption in internet connection the acquired data will be lost. Postolache et al. [12] presented a Wi-Fi indoor air quality management system with multiple sensor nodes. The system employed Lab VIEW web server and laptop as main processing and control unit which performed neural network analysis on the received from each sensor node. Proposed System Most of the above studies are have not considered possible remedies that may be employed to reduce the harmful effect of toxic gases. In this proposed system that have devised an IOT based Air contamination observing framework using Google cloud that monitors the air quality in real time using sensors for measuring Air Quality parameters. Cloud computing platform is utilized to store and process data. The system will generate an alert when quality of air deteriorates beyond the permissible limits. If the air quality is detected at environment of university level, preventive measures may be implemented which will reduce potential risks to students, staff and environment residents. Further, analysis of causes of increased pollutants at an instant of time would benefit those potentially endangered by significantly high concentrations of air pollutants. The rest of the proposed system is organized as follows section A deal with system overview design, before the conclusion section provides the results, methods to improve air quality are discussed in the end of section concludes the paper. A.System Design of Air Quality Monitoring System The air quality monitoring system proposed in this work has four main sensors assembly and ESP 8266 based IoT board. Some of the important features that need to be considered for selecting IoT platform for a particular application are the size of memory, number of general purpose input pins, peripheral communications such as SPI, I2C, USART and its communication capacities like Ethernet, Wi-fi, Bluetooth, Zigbee etc. ESP 8266 module is one of the most powerful IoT enabled boards that satisfies the requirement of present application. It consists of a 32-bit RISC CPU: Tensilica Xtensa LX106 ,64 KB internal memory, 96 KB memory for data storage and 4MB Flash memory. Google script can generate its own Wi-fi network via connectivity module ESP8266. Architecture of the proposed IoT Indoor/Outdoor Air Quality management system is shown in Fig. 2. Data generated by the Air Quality sensor is first received and processed by PIC18F45K22, microcontroller. It has five ports, three timers and it can support various communication protocols. Some of the important supported protocols are Parallel protocol, Serial Protocol and Inter-Integrated Circuit (I2C) protocol. The gateway for data transmission to the cloud was built using connectivity module ESP8266 on the Google IoT cloud platform. The gateway operates on TCP/IP protocol. The sensor data is converted to IP packets and forwarded over the Wi-Fi network. Transmitted data is stored and further processed at Google cloud and an alert is generated if air quality deteriorates below a certain threshold. [8][9]. Temporal Fig.2. System overview of the Air Quality Monitoring System B.Block Diagram The block diagram of the proposed the system is shown inFig.3.Our proposed system acquires inputs from various sensors which detect air quality. These acquired inputs are conditioned and provided to the control unit which processes these signals. The algorithm in the control unit predicts the air quality and this information are transmitted to the traffic control station. Based on this information traffic can be regulated to control air quality. This information can also be viewed using a mobile application. This additional feature allows users to follow less polluted routes thereby indirectly bringing down pollution in highly polluted areas. System overview of the Air Quality Monitoring System is shown in Fig.2. Fig.3.Block Diagram of Proposed system C.Experimental Setup The proposed PIC18F45k22.The environmental setup for the developed system is shown in Fig 4.The work was prototyped and we have we considered sensors, MQ-7 which measures carbon- monoxide, MQ135-which measures ammonia, MQ4-which measures methane gas, and G37-for amount of oxygen. The sensor inputs are acquired and undergo signal conditioning. The output from the signal conditioning circuit is then provided as input to an analog to digital converter of 10 bit resolution, which inputs these PIC18F45K22. system was developed using the which is a 40-pin @ IJTSRD | Unique Paper ID – IJTSRD26554 | Volume – 3 | Issue – 5 | July - August 2019 Page 1029
International Journal of Trend in Scientific Research and Development (IJTSRD) @ www.ijtsrd.com eISSN: 2456-6470 The inputs are given to an air quality monitor algorithm which gets input values and compares them with threshold values. The air quality information is then transmitted via a WiFi transceiver-ESP 8266 to a remote server from where this information can be accessed by the traffic control station. This information can also be accessed through a mobile application. The designed system not only sends a message but also displays the status of the parameters of air quality through a CLCD display. Fig.6. ESP 8266 Google sheet Conclusion The proposed system was designed and tested in IoT environment. It measures the air quality of a particular area with the help of the hardware module fixed at certain locations like lamp posts. The proposed system collected real time pollution statistics using various sensors which monitored percentage of gases like ammonia, oxygen and carbon monoxide. Using these inputs the algorithm predicted the air quality. Although there are a huge number of existing systems, the proposed system provides a unique feature by transmitting calculated information for traffic control purposes if the air quality is harmful. The additional benefit of the proposed system is the mobile application which will help the common guy understand and be aware of the pollution status of localities. This information can also lead to people making a contribution directly to reduce pollution levels. This proposed system can be optimized to consume less power as this will be a battery or solar powered module. FUTURE WORK This module can be deployed in all cities selected for the smart city project in our country. This will make our smart cities places where people can live a healthier life. REFERENCES [1]Hugo Destaillats, RandyL. Maddalena, BrettC. Singer, AlfredT. Hodgson and Thomas E. McKone “Indoor pollutants emitted by office equipment: Are view of reported data and information needs”, Atmosphere Journal, Volume42, ISBN-1352-2310, 2008. Fig.4. Environmental setup of proposed system Wi-Fi Module Fig.5. ESP 8266 Wi-Fi enabled IoT Platform Cloud computing is the platform of us in gremote servers on the internet to control, store and process data in its place of using a Personal Computer. It is an integral part of IoT based systems. ESP 8266 Wi-Fi module is shown in Fig. 5. It is configured using Net plug application that shows the list of all the devices connected and the nusing a password and wi-fi name, procedure can be configured. The data received by sensor is saved in PIC18F45K22 and it is uploaded on the Google cloud via ESP 8266 Wi-Fi Module. The system utilizes Google’s quick alert system that is configured to send alerts to the contacts listed when the threshold is crossed. Results And Discussion A.Test case The proposed system was prototyped and tested. The system was validated using various test cases Test case-1: Acquiring inputs from sensor Test case-2: Processing data Test case-3: Wireless Transmission Test case-4: Display of gases present in CLCD. The proposed system data stored in Google cloud is shown in Fig.6. [2]IngridJohansson, AndersKumlin, ”Emissions from concrete an indoor air qualityissue?”10th Nordic Symposium on Building Physics,pp-330-337. PeterCarlsson, MikaelSandberg, [3]Wen-BenYang, Wei-HsiangChen, Chung-ShinYuan, Jun- ChenYangandQing-LiangZhao,’ assessments of VOC emission rates and associated health risks from waste water treatment processes, Royal Society of Chemistry, 2012. Comparative [4]LilliKirkeskovJensen, Annelise Larsen, LarsMolhave, Mogens KraghHansen, Evaluation of Volatile Organic Compound (VOC) Emissions from Wood and Wood-Based Materials’, Archives of Environmental Issue5,Pages419-432,2001. BodilKnudsen‘ Health Health,Volume56, [5]AmbientAirPollutionDatabase,WHO2014 [6]B. F. Yu, Z. B. Hu, M. Liu, H. L. Yang, Q. X. Kong, Y. H. Liu, Review of research on air-conditioning system sand @ IJTSRD | Unique Paper ID – IJTSRD26554 | Volume – 3 | Issue – 5 | July - August 2019 Page 1030
International Journal of Trend in Scientific Research and Development (IJTSRD) @ www.ijtsrd.com eISSN: 2456-6470 [9]J. S. Kiurski, I. B. Oros, V. S. Kecic, I. M. Kovacevic and S. M. Aksentijevic,” The temporal variation of indoor pollutants in photocopying Environmental Research and Risk Assessment, vol.30, no.4, pp.1289-1300, 2016 indoor air quality control for human health, International Journal of Refrigeration, Volume32, Issue1, Pages3-20, 2009. shop,” Stochastic [7]Pallavi Asthana; Sumita , IoT Enabled Real Time Bolt based Indoor Air Quality Monitoring System, 2018 International Conference on Computational and Characterization Techniques in Engineering & Sciences (CCTES)Integral University, Lucknow, India, Sep 14-15, 2018 [10]Fioccola, G. B.; Sommese, R.; Tufano, I.; Canonico, R.; Ventre, G. Polluino’ An efficient cloud-based management of IoT devices for air quality monitoring’ IEEE2nd International Forum on Research and Technologies for Society and Industry Leveraging a Better Tomorrow (RTSI), 2016. [8][9]RivelinoM.CavalcanteMárciaV.F.deAndradeRozaneV. MarinsLincolnD.M.Oliveira,’Development of a head space-gas chromatography(HS-GC-PID-FID) method for the determination of VOCs in environmental aqueous matrices: Optimization, verification and elimination of matrix effect and VOC distribution on the Fortaleza Coast, Brazil, Micro chemical Journal, Volume96, Issue 2, Pages337-343, 2010 [11]Postolache, O. A.; Pereira, J. D.; Girão, P. S. Smart sensors network for applications. IEEE Trans. In strum. Meas., 58, 3253– 3262, 2009. air quality monitoring @ IJTSRD | Unique Paper ID – IJTSRD26554 | Volume – 3 | Issue – 5 | July - August 2019 Page 1031