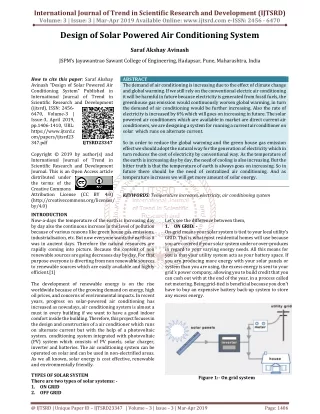
Download
1 / 4
40 likes | 100 Vues
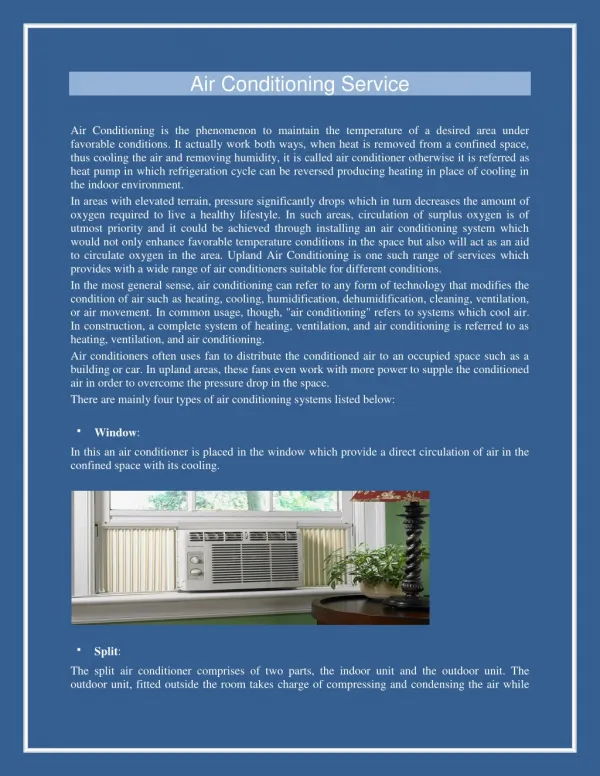
Air conditioning has great importance in many areas of life. Especially it is crucial in transportation sector. Many people spend long time in an automotive cabin during business, travel, shopping, etc., every day. The aim of this study is to analyze the performance of a bus shell by considering identifying practical solutions in order to reduce the impact of air conditioning on bus, consumption and, therefore, on air pollution. The analysis is carried considering several parameters, including passenger capacity, local climatic conditions, fuel consumptions, and latitude and longitude of starting destination of the places. For the analysis, a bus with passenger capacity of 60 people is selected and then it's heat load capacity will be determined by considering different conditions like seasons and various loads. The influence of the refrigerant decrease and the change of the air temperature which gets to exchangers on the refrigeration efficiency of the system to be analyzed. Also, its effectiveness and the power required to drive the compressor will be analyzed. The entire model, its analysis and results are discussed in the below work. Dr. S. Sreenatha Reddy | P. Akhil | N. Raju | K. Vishnu | N. Ashok "Analysis of Air Conditioning System used in Automobile" Published in International Journal of Trend in Scientific Research and Development (ijtsrd), ISSN: 2456-6470, Volume-3 | Issue-3 , April 2019, URL: https://www.ijtsrd.com/papers/ijtsrd23357.pdf Paper URL: https://www.ijtsrd.com/engineering/mechanical-engineering/23357/analysis-of-air-conditioning-system-used-in-automobile/dr-s-sreenatha-reddy<br>

E N D
International Journal of Trend in Scientific Research and Development (IJTSRD) Volume: 3 | Issue: 3 | Mar-Apr 2019 Available Online: www.ijtsrd.com e-ISSN: 2456 - 6470 Analysis of Air Conditioning System used in Automobile Dr. S. Sreenatha Reddy1, P. Akhil2, N. Raju2, K. Vishnu2, N. Ashok2 1Principal, 2Student 1,2Department of Mechanical Engineering, Guru Nanak Institute of Technology, Hyderabad, India How to cite this paper: Dr. S. Sreenatha Reddy | P. Akhil | N. Raju | K. Vishnu | N. Ashok "Analysis of Air Conditioning System used in Automobile" Published in International Journal of Trend in Scientific Research and Development (ijtsrd), ISSN: 2456- 6470, Volume-3 | Issue-3, April 2019, pp.1295-1298, URL: https://www.ijtsrd.c om/papers/ijtsrd23 357.pdf Copyright © 2019 by author(s) and International Journal of Trend in Scientific Research and Development Journal. This is an Open Access article distributed under the terms of the Creative Commons Attribution License (CC BY 4.0) (http://creativecommons.org/licenses/ by/4.0) I. INTRODUCTION The bus air conditioning system mainly consists of the condenser, evaporator, compressor, magnetic clutch, alternator, fresh air device, blower, fan, return air grille, control panel, pipeline system and electric-controlled system. The reservoir, filter direr, sight glass, cut-off valve, expansion valve, and fresh air device are in the interior of the evaporator. The compressor is mounted on the side of the engine, and the climate control panel of the bus air conditioning system has its own starting system, which is located beside of the instrument board. The rooftop mounted evaporator assembly of bus air conditioning are adopting the SMC housing to protect its components and remain a good insulation performance (Most bus air conditioning system’s evaporator use the traditional FRP housing, but Guchen adopts the SMC and LFT housing materials which is lighter, higher strength and more environmental). The condenser is mainly divided into new design Multi-flow-condenser (micro channel condenser) and traditional copper and fin condenser, the condenser fan blows the air through the condenser coil, in order to aid the heat dissipation better. When you press the ON/OFF button on control panel of bus air conditioning in the driver’s cabin, relying on an inter ABSTRACT Air conditioning has great importance in many areas of life. Especially it is crucial in transportation sector. Many people spend long time in an automotive cabin (during business, travel, shopping, etc.,) every day. The aim of this study is to analyze the performance of a bus shell by considering identifying practical solutions in order to reduce the impact of air conditioning on bus, consumption and, therefore, on air pollution. The analysis is carried considering several parameters, including passenger capacity, local climatic conditions, fuel consumptions, and latitude and longitude of starting destination of the places. For the analysis, a bus with passenger capacity of 60 people is selected and then it’s heat load capacity will be determined by considering different conditions like seasons and various loads. The influence of the refrigerant decrease and the change of the air temperature which gets to exchangers on the refrigeration efficiency of the system to be analyzed. Also, its effectiveness and the power required to drive the compressor will be analyzed. The entire model, its analysis and results are discussed in the below work. KEYWORDS: Refrigerant, Effectiveness, Efficiency IJTSRD23357 connecting electrical system, the compressor is driven by the electromagnetic clutch via the belt which connected to driven pulley of engine, then the compressor circulates refrigerant through the internal connecting hoses system. The cycle is shown in the below figure 1. Fig 1: Refrigeration cycle LITERATURE SURVEY II. @ IJTSRD | Unique Paper ID – IJTSRD23357 | Volume – 3 | Issue – 3 | Mar-Apr 2019 Page: 1295
International Journal of Trend in Scientific Research and Development (IJTSRD) @ www.ijtsrd.com eISSN: 2456-6470 F.Performance evaluation and economic analysis: The energetic and economical effectiveness of the system was evaluated. The life cycle costs for solar cooling system were calculated and competitiveness with regards to price and thermal efficiency for domestic applications determined. g) Analysis of results and making of recommendations: The results were analyzed, and necessary improvements recommended. Options for improving technical effectiveness and economic competitiveness were suggested. Ways of improving research and development efforts in this field were also investigated. We consider a lumped model of a typical vehicle cabin. The net heat gain by the cabin can be classified under nine different categories. The total load as well as each of these loads can either be positive (heating up the cabin) or negative (cooling down the cabin) and may depend on various driving parameters. In the following, the models developed for each of these load categories are presented and discussed. Some of the correlations used in the present model are based on experiments performed on certain vehicles, which are used here for general validation of the model. New correlations can be readily plugged into the present model can be tailored to any new vehicle, after specifying those correlations for the case. Designing of Automobile by CATIA V5 Starting of CATIA V5 is with a new name which will be displayed on the screen. Close the product1 file and start a new file in the part design workbench. After choosing to close the file menu, then start screen of CATIA is displayed. Start >> Mechanical Design >> select Sketcher or part design To start a new file in the part design workbench, choose file from the menu bar. The new dialog box is displayed. After accomplishment all the necessary cuttings and modifications of the Air Filter, the ultimate model looks as shown in figures. M. Hegar examines how to verify experimentally whether an air conditioning system meets design and comfort requirements. An experimental study was conducted on a prototype bus and was tested when driving on the Adana- Ceyhan highway in Turkey. The internal and external temperatures, evaporator inlet and outlet temperatures and relative humidity values were measured. Thermal sensation values were calculated by using empirical correlations given by ASHRAE [1]. Kutlu C Studied theoretical investigation of two-evaporator ejector refrigeration system was carried out using R134a and alternative refrigerants. The relative increase in COP with respect to the conventional refrigeration system was analyzed. Also, exergy analyses of systems were examined, and results were showed.[2] Paul Maina investigated the influence of variables such as; refrigerant amount, chilling and cooling water temperature, throttle valve opening, cooling and chilling water flow rates, on the efficiency of a water to water carbon dioxide heat pump. It was observed that cooling water temperature had the highest influence followed by the chilling water temperature. Surprisingly, the amount of the refrigerant was third followed by the Understandably, chilling water flow rate had the least effect on the COP [3]. J. Brusey proposed that energy-efficient vehicle comfort control as a Markov Decision Process, which is then solved numerically using Sarsa and an empirically validated, single- zone, 1D thermal model of the cabin. The resulting controller was tested in simulation using 200 randomly selected scenarios and found to exceed the performance of bang- bang, proportional, simple fuzzy logic, and commercial controllers with 23%, 43%, 40%, 56% increase, respectively [4]. Solmaz O studied the Artificial Neural Networks method for prediction hourly cooling load of a vehicle. For ANN model, seven neurons determinate as input signals of latitude, longitude, altitude, day of the year, hour of the day, hourly mean ambient air temperature and hourly solar radiation were used for the input layer of the network. One neuron producing an output signal of the hourly cooling load was utilized in the output layer [5]. III. METHODOLOGY The given process is followed in basis of calculation of load calculation A.Collection of the required meteorological data: meteorological data for meteorological year (TMY) was created and the hourly, monthly and annual values of solar radiation processed. B.Cooling load calculation: Determine what kind of cooling and how much of cooling needed. C.Design and sizing of the air conditioning system: Using the weather data, and the selected design conditions, the components of the system could be sized. D.Optimization of the system: The aim was to use least cost energy, so the designed system was optimized with that in mind. E.Material procurement and construction of the experimental system: Once the system had been optimized, the components were procured, and the system was constructed and tested. throttle valve opening. calculation A typical Fig 2: Wireframe Model @ IJTSRD | Unique Paper ID - IJTSRD23357 | Volume – 3 | Issue – 3 | Mar-Apr 2019 Page: 1296
International Journal of Trend in Scientific Research and Development (IJTSRD) @ www.ijtsrd.com eISSN: 2456-6470 QDif = 30*0.5*72.97 = 1094.55 W QRef = ∑ SτiRef iRef = (iDir+iDif)*ρg*(1-cos ∑)/2 = (417+72.97) *0.2*(1-cos 900)/2 = 148.997 W/m2 QRef = 30*0.5*148.997 = 2234.9555 W QS.Rad = Sα (iDircosө+iDif+iRef) =30*0.3(1417*cos750+72.97+148.997) for glass = 5298.422 W QS.Rad=37.36*0.4(1417*cos750+72.97+148.997) for surface = 8797.73 W QS.Rad = 5298.422+8797.93 = 14096.352 W 3.AMBIENT LOAD The ambient load is the contribution of the thermal load transferred to the cabin air due to temperature difference between the ambient and cabin air. QAmb = ∑ SU(Ts-Ti) For glass S = 30 m2 Speed = 60 kmph V = 60*5/18 = 16.66 m/s Where U is the overall heat transfer coefficient of the surface element U = 1/R Where R =1/h0+χ/k+1/hi R is the net thermal resistance for a unit surface area. ho and hi are the outside and inside convection coefficients, k is the surface thermal conductivity, and λ is the thickness of the surface element. h = 0.6+6.64(V)0.5 Where h is the convection heat transfer coefficient in W/m2K, and V is the vehicle speed in m/s. hi = 0.6 h0 = 0.6+6.64(16.66)0.5 = 27.70 For glass k = 1.05, χ = 0.003 m R = 1/27.70 + 0.003/1.05 + 1/0.6 R = 1.705 m/W/m. K U = 1/1.705 = 0.586 W/m2.K QAmb = 30*0.586*(60-30) = 527.4 W For surfacek = 0.2, χ = 10, S = 37.36 m2 R = 1/27.70 + 0.01/0.2 + 1/0.6 = 1.753 m/W/m. K U = 1/1.753 = 0.570 W/m2.K QAmb = 37.36*0.570*(60-30) = 638.856 W QAmb = Glass + Surface = 527.4 + 638.856 = 1166.256 W 4.EXHAUST LOAD The exhaust heat load entering the cabin can be written as QExh = SExhU(TExh-Ti) TExh = 0.138RPM-17 = 0.138*6000-17 Fig 3: 3D Model IV. 1.METABOLIC LOAD The metabolic load can be calculated by QMet = ∑ MADu RESULTS AND DISCUSSIONS Where M is passenger metabolic heat production rate =85 W/m2 for driver =55 W/m2 for passenger M=85+55*59 (no. of passengers) =3330 W/m2 ADu=Body surface area ADu=0.202W0.425H0.725 where Wand Hare the passenger weight and height =0.202*650.425*1.70.725 =1.749504 m2 QMet = 3330*1.749504 = 5825.84832 W 2.RADIATION LOAD Direct radiation is that part of the incident solar radiation which directly strikes a surface of the vehicle body, which is calculated from QDir = ∑ SτiDir cos ө According to ASHRAE 2007-chapter 33 Table no. 20 Peak load = 1417 W/m iDir = 1417 W/m2 Glass surface area S= 30 m2 τ = 0.5 ө = 750 QDir = 30*0.5*1417*cos (750) = 5501.19 W QDif = ∑ SτiDif iDif = CiDir (1+cos ∑)/2 =0.103*1417*(1+cos 900)/2 =72.97 W/m2 @ IJTSRD | Unique Paper ID - IJTSRD23357 | Volume – 3 | Issue – 3 | Mar-Apr 2019 Page: 1297
International Journal of Trend in Scientific Research and Development (IJTSRD) @ www.ijtsrd.com eISSN: 2456-6470 = 811 K QExh = 15.3*0.570*(811-303) = 6817.101 W 5.ENGINE LOAD QEng = SEngU(TEng-Ti) TEng = -2*10-6*RPM2+0.0355*RPM+77.5 = -2*10-6*60002+0.0355*6000+77.5 = 218.5 K QEng = 1.7*0.570*(218.5-30) =182.65 W 6. VENTILATION LOAD According to psychrometric calculations, ventilation heat gain consists of both sensible and latent loads. To account for both these terms, assuming a known flow rate of fresh air entering the cabin, the amount of thermal heat gain can be calculated from QVen = mVen(e0-ei) Where mVen is the ventilation mass flow rate and eo and ei are the ambient and cabin enthalpies, respectively. Enthalpies are calculated from e = 1006*T+(2.501*106+1770T) X e0=1006*40+(2.501*106+1770*40)0.3 X=0.3) = 811780 J/kg ei = 1307230 J/kg (Ti = 30, X=0.5) Where T is air temperature and X is humidity ratio in gram of water per gram of dry air. mVen = 0.02 kg/s QVen = 0.02(811780-1307230) = -9909 W 7. AC LOAD QAC=(QMet+QDir+QDif+QRef+QS.Rad+QExh+QEng+QVen)-(maca+DTM) (Ti-TComf)/tc Here ma = 44.488 kg ca = 1.005 DTM = 5.6 kJ/kg TComf = 20 Ti = 30 tc = 600 sec QAC = -27003.70382-0.8348 W = -27.838 kW 1 TR = 0.284 kW QAC = 27.838*0.284 = 7.906 TR A graph is drawn in below figure 4 according to the TR values obtained by the analysis using excel sheets. Fig 4: TR variation curve According to the layout of automobile we have done analysis by taking the number of people 60, 30 and 02 in the bus in three seasons like summer, winter and rainy seasons. Within these conditions we have calculated the various loads and TR. The obtained total load for the automobile is 27.84 kW and the TR is 7.90696. The best suitable refrigerant which removes the calculated amount of heat with minimum torque is R-134a. The compressor which consumes least torque from the engine selected is Valeo TM65 based on the TR value obtained. References [1]M. Hegar M., M. Kolda, M. Kopecka, V. Rajtmajer, A. Ryska, Bus HVAC energy consumption test method based on HVAC unit 85ehavior, International Journal of Refrigeration, 36 (2013) 1254-1262. (T0=40, [2]Kutlu Ç., Ünal Ş., Erdinç M. T... Thermodynamic analysis of bi-evaporator ejector refrigeration cycle using R744 as natural refrigerant. Journal of Thermal Engineering, 2,735-740, 2016. [3]P. Maina, Z. Huan, Effects of various parameters on the efficiency of a CO2 heat pump: Astatistical approach, journal of thermal engineering, 1(4) (2015), 263-278. [4]Hintea, D., Brusey, J., Gaura, E., Kemp, J., Beloe, N., 2013. Comfort in cars estimating equivalent temperature for comfort driven heating, ventilation and air conditioning (HVAC) control. In: Conference Proceedings of the Informatics in Control, Automation and Robotics (ICINCO 2013). [5]Ozgoren M, Solmaz O, Kahraman A. Prediction of hourly cooling load capacity of an automotive air-conditioning system. In: International ege energy symposium and exhibition (IEESE-5), 27–30 June 2010, Pamukkale University, Denizli-Turkey. @ IJTSRD | Unique Paper ID - IJTSRD23357 | Volume – 3 | Issue – 3 | Mar-Apr 2019 Page: 1298