Download
1 / 7
70 likes | 72 Vues
Urban renewal has been regarded as a sound approach to promoting land values and improving environmental quality. An urban renewal programs is supposed to address undesirable urban conditions. However, the real problem in this regard is that the determination of the level of substandard situations that can be considered undesirable is usually based on planning standards and varies from place to place and time to time. This study attempts to review the general concept of urban renewal and various approaches. It highlights the existing physical and socio economic characteristics of the study area. To establish how urban renewal programs can be achieved simultaneously using GIS .The methodology included digital mapping techniques, ground survey to establish the factors responsible for deterioration in the study area, conversion of surveyed data into digital form as attribute of the spatial data variables considered and query of each variables to show individual conditions in the study area. The results obtained showed that GIS easily allowed the linking of spatial data with attribute data based on which queries and spatial analysis carried out. The level of deterioration is determined using weighted index analysis method of identifying a slum, thus major rehabilitation is suggested as the best approach for the study area. Finally, a renewal plan is proposed as way of solving the identified problems in the study area. Efunnuga Oluwayemisi Bunmi | Ituma Chijioke Gideon | Idakwo Victor Iko-Ojo "Application of Geographic Information System (GIS) For Urban Renewal: A Case Study of Yelwan Tudu of Bauchi State, Nigeria" Published in International Journal of Trend in Scientific Research and Development (ijtsrd), ISSN: 2456-6470, Volume-3 | Issue-2 , February 2019, URL: https://www.ijtsrd.com/papers/ijtsrd21395.pdf Paper URL: https://www.ijtsrd.com/engineering/environment-engineering/21395/application-of-geographic-information-system-gis-for-urban-renewal-a-case-study-of-yelwan-tudu-of-bauchi-state-nigeria/efunnuga-oluwayemisi-bunmi<br>

E N D
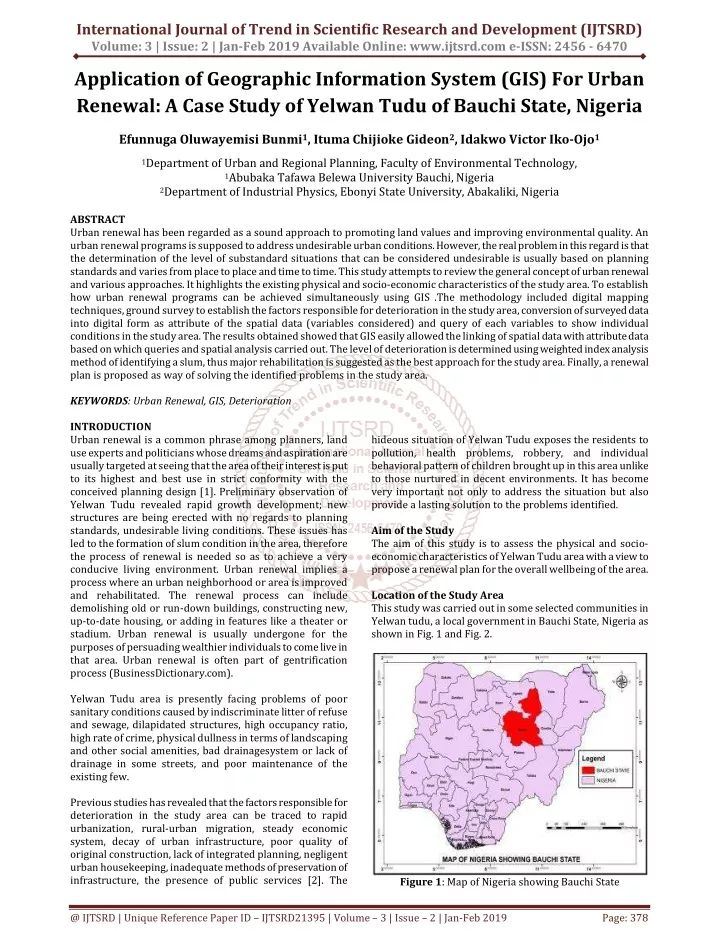
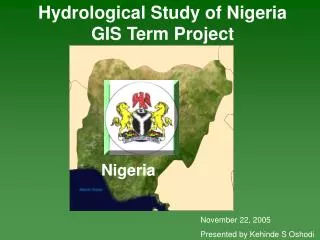
International Journal of Trend in Scientific Research and Development (IJTSRD) Volume: 3 | Issue: 2 | Jan-Feb 2019 Available Online: www.ijtsrd.com e-ISSN: 2456 - 6470 Application of Geographic Information System (GIS) For Urban Renewal: A Case Study of Yelwan Tudu of Bauchi State, Nigeria Efunnuga Oluwayemisi Bunmi1, Ituma Chijioke Gideon2, Idakwo Victor Iko-Ojo1 1Department of Urban and Regional Planning, Faculty of Environmental Technology, 1Abubaka Tafawa Belewa University Bauchi, Nigeria 2Department of Industrial Physics, Ebonyi State University, Abakaliki, Nigeria ABSTRACT Urban renewal has been regarded as a sound approach to promoting land values and improving environmental quality. An urban renewal programs is supposed to address undesirable urban conditions. However, the real problem in this regard is that the determination of the level of substandard situations that can be considered undesirable is usually based on planning standards and varies from place to place and time to time. This study attempts to review the general concept of urban renewal and various approaches. It highlights the existing physical and socio-economic characteristics of the study area. To establish how urban renewal programs can be achieved simultaneously using GIS .The methodology included digital mapping techniques, ground survey to establish the factors responsible for deterioration in the study area, conversion of surveyed data into digital form as attribute of the spatial data (variables considered) and query of each variables to show individual conditions in the study area. The results obtained showed that GIS easily allowed the linking of spatial data with attribute data based on which queries and spatial analysis carried out. The level of deterioration is determined using weighted index analysis method of identifying a slum, thus major rehabilitation is suggested as the best approach for the study area. Finally, a renewal plan is proposed as way of solving the identified problems in the study area. KEYWORDS: Urban Renewal, GIS, Deterioration INTRODUCTION Urban renewal is a common phrase among planners, land use experts and politicians whose dreams and aspiration are usually targeted at seeing that the area of their interest is put to its highest and best use in strict conformity with the conceived planning design [1]. Preliminary observation of Yelwan Tudu revealed rapid growth development; new structures are being erected with no regards to planning standards, undesirable living conditions. These issues has led to the formation of slum condition in the area, therefore the process of renewal is needed so as to achieve a very conducive living environment. Urban renewal implies a process where an urban neighborhood or area is improved and rehabilitated. The renewal process can include demolishing old or run-down buildings, constructing new, up-to-date housing, or adding in features like a theater or stadium. Urban renewal is usually undergone for the purposes of persuading wealthier individuals to come live in that area. Urban renewal is often part of gentrification process (BusinessDictionary.com). Yelwan Tudu area is presently facing problems of poor sanitary conditions caused by indiscriminate litter of refuse and sewage, dilapidated structures, high occupancy ratio, high rate of crime, physical dullness in terms of landscaping and other social amenities, bad drainagesystem or lack of drainage in some streets, and poor maintenance of the existing few. Previous studies has revealed that the factors responsible for deterioration in the study area can be traced to rapid urbanization, rural-urban migration, steady economic system, decay of urban infrastructure, poor quality of original construction, lack of integrated planning, negligent urban housekeeping, inadequate methods of preservation of infrastructure, the presence of public services [2]. The hideous situation of Yelwan Tudu exposes the residents to pollution, health problems, robbery, and individual behavioral pattern of children brought up in this area unlike to those nurtured in decent environments. It has become very important not only to address the situation but also provide a lasting solution to the problems identified. Aim of the Study The aim of this study is to assess the physical and socio- economic characteristics of Yelwan Tudu area with a view to propose a renewal plan for the overall wellbeing of the area. Location of the Study Area This study was carried out in some selected communities in Yelwan tudu, a local government in Bauchi State, Nigeria as shown in Fig. 1 and Fig. 2. Figure 1: Map of Nigeria showing Bauchi State @ IJTSRD | Unique Reference Paper ID – IJTSRD21395 | Volume – 3 | Issue – 2 | Jan-Feb 2019 Page: 378
International Journal of Trend in Scientific Research and Development (IJTSRD) @ www.ijtsrd.com eISSN: 2456-6470 Figure 2: Map of Bauchi showing Bauchi Local Government Area. Figure 5: Map showing the existing circulation system of Yelwan Tudu MATERIALS AND METHOD Bauchi metropolis is located within coordinates located between latitudes 9° 3' and 12° 3' north and longitudes 8° 50' and 110 east. Yelwan Tudu is located in Bauchi local government area which falls within Bauchi metropolis. Yelwan Tudu is bounded by Unity College to the north, Yelwan kagadama to the south, Lushi village to the east and Angwan cashew to the west. METHODOLOGY STRUCTURE The methodology adopted has three stages of map preparation, attribute data generation, GIS data input and analysis. A.Stage 1: Preparation of Base Map To prepare the base map Yelwan Tudu, GIS techniques was employed. To obtain reasonable precision in the mapping process, a 10m resolution imagery of Yelwan Tudu was obtained and coordinate points were there after taken for the purpose of geo-referencing. The imagery (Google Earth Pro 2012) was imported as a JPEG file into the ArcGis 10.1software environment and geo-referenced using the already obtained coordinate points. B.Stage 2: Generation of attribute data and database creation The generation of attribute data involved field survey of the study area in which basic data sets were collected. This includes, the spatial information defining each individual property and its boundary; and the attribute data associated with each property. This information was gathered verbally via individual household data form, which was transformed as attributes into map form with the use of ArcGis. In developing various maps, showing the variables for determining the level of deterioration and using the number of buildings in the study area as guiding criteria is essential. The surveyed plan was later used as a way of referencing or linking the attribute data with the corresponding spatial data to create a database. C.Stage 3: GIS data input and analysis To gain insight into the overall physical and socio- characteristics of the study area, the database needs to be queried to reveal the current condition of each variable based on the criteria for determining each variable. This was achieved using the select by attribute query module in ArcGIS 10.1 The overall aim here was to classify the condition of each variable as bad, fair or good. This categorization is based weighted index analysis. PHYSICAL CHARACTERSITICS A.Climate Condition Yelwan Tudu has a rainfall regime ranging from 1,300mm per annum in the south which starts in the month of April. In contrast, the north receives rain late around the month of June/July with a maximum of 700mm per annum. Figure 3: Map of Bauchi Local Government Area showing the study area Figure 4: Map of Yelwan Tudu @ IJTSRD | Unique Reference Paper ID – IJTSRD21395 | Volume – 3 | Issue – 2 | Jan-Feb 2019 Page: 379
International Journal of Trend in Scientific Research and Development (IJTSRD) @ www.ijtsrd.com eISSN: 2456-6470 B.Humidity The humidity in the area is humidly hot during the early part of the rainy season. While towards the EMBER months and early January, there is cold weather. The relative humidity shows a marked decrease from the early morning to the afternoon throughout the year. Associated with the high relative humidity the cloudiness over the area is usually extensive. C.Wind The wind direction is mostly dominated by the seasonal movement of inter-tropical convergence zone which represents the moving frontier between most Atlantic air from the south and the dry air from the Sahara. D.Vegetation The area covers the Sudan Savannah where the vegetation gets richer towards the south especially along water source or rivers but generally, the vegetation is less uniform and grasses are shorter than what obtains further south that is the forest zones of the middle belt. E.Topography It entails the sloppiness or gradient of an area. The topography of Yelwan Tudu is relatively flat. F.Temperature Highest temperature always tends to occur at the end of the dry season close to spring equinox. Thus March has the highest temperature. The lowest temperature occurs in the middle of the dry season in December or January. SOURCES OF DATA COLLECTION Basically, there are two major sources of data; primary and secondary source. ?Primary data; Primary data used in the research include data obtained using the individual household interview data form and satellite images of the study area. The individual household interview data form focused on the five indicators: sources of water supply, means of waste disposal, income level, age of building and building condition. Qualitative data, in the form of recent satellite imageries was also used. In addition, relevant information was extracted from existing and related studies on the subject matter and study area. The selected neighborhood serves as sample frame boundary for the research, in which the individual house units are the sample units ?Secondary source; data is collected through the following; Internet, Journals, Books, Dissertations, and Encyclopedia etc. FACTORS RESPONSIBLE FOR THE DETERIORATION OF YELWAN TUDU There are basically five types of techniques, which are commonly used to determine the extend or factors responsible for the deterioration in any urban area. The essence of these techniques is to devise strategies responsible for the physical condition of housing, facilities, utilities, services and the general environmental quality of any urban area, so as to determine the appropriate renewal plan to be implemented in order to improve the general living standard of people. ?Cost Benefit Analysis ?Multi-variant Analysis ?Rough Screening Method ?Weighted Index Analysis ?Multiple Index Analysis A.Weighted Index Analysis This is a multi-criteria urban renewal technique .At this stage the variables and criteria are weighted based on their level of importance to produce the levels of deterioration for each variable in the study area. In this method, the assessment is more detailed but proceeds like the rough screening method in the following steps; ?As in rough screening method ?Assess the area on all the criteria of buildings and environmental conditions using quantifiable scores values. This involves deciding weights for the criteria based on residents, priorities and other critical conditions ?Rank the zones into grades needing specific renewal actions. This involves the total weighted scores for the zones and then grading the zones based on a chosen sliding scale. This method as applied to the study area was partly based on the field survey, observation made and partly individual resident preference to utilities, facilities and services and their general conceptions about them. Weight each blight or slum indicator from 3 to 1 scores as the indicators in the respective variable or unit. The lower the score, the higher the slum intensity as indicated below: Key: 3-Good 2-Fair 1-Bad The total weight scores from each zone are put into scale 1-3 to determine the level of deterioration and the planning action to be required. B.Composite Level of Deterioration This is the general map overlay of the variables to produce the final deterioration levels by score Table1. Weight Score and Action Required Level of Deterioration Deterioration Category of Planning Action Required Total Clearance/ Redevelopment 1st Order Bad 2nd Order Fair Upgrade 3rd Order Good Rehabilitation Source [3] @ IJTSRD | Unique Reference Paper ID – IJTSRD21395 | Volume – 3 | Issue – 2 | Jan-Feb 2019 Page: 380
International Journal of Trend in Scientific Research and Development (IJTSRD) @ www.ijtsrd.com eISSN: 2456-6470 Table2. Variables for evaluating physical condition of the study area Major Variables Sub-Variables Criteria scores Comparism between existing land uses and land use standard 0 400 m 400m 800m 800m - above 0 400 m 400m 800m 800m - above Dump site Burning of waste Dust bin None Well Borehole Tap Less than 20 years 20 40 years 40 above Periodic maintenance Low level of maintenance No maintenance Below 15,000 15,000 25,000 25000 - above Land use Land use types Schools Health Facilities Utilities, Facilities and Services Means of waste disposal Sources of water supply 3 good 2 fair 1 - bad 3 good 2 fair 1 - bad 1 low 2 medium 3 - high Building Building Age Building Condition Income Level RESULT AND DISCUSSION The importance of urban renewal is to improve the environmental quality and living standard of people so as to achieve functional and aesthetic environment. Data presentation and analysis is the process of organizing, grouping and analyzing the existing physical and socio-economic data, using the urban renewal techniques to determine the level of deterioration. The total land area coverage of Yelwan Tudu is 147.37 hectares, having a total population of 9595.Below is the tabular representation of population distribution of the study area. Table3. Age Sex Distribution Age Male Percentage Female Percentage Total Percentage 0 4 936 9.75 867 5 9 548 5.71 479 10 -14 324 3.37 255 15 -19 354 3.68 385 20 24 491 5.11 462 25 29 562 5.85 593 30 34 398 4.14 429 35 39 235 2.44 266 40 44 302 3.14 331 45 49 205 2.13 236 50 54 165 1.71 196 55 59 198 2.10 159 60 - above 114 1.23 105 Total 4832 50.36 4763 Source, field survey, 2017 LAND USE ANALYSIS Table 4: Existing Land Use Budget of the Study Area Land Uses Meter(m2) Hectares Percentage(%) Commercial 18212 Recreation 1606 Residential 342070 Public/Semi Public 764935 Circulation 223094 Open spaces 123853 Total 1473770 Source, field survey, 2017 9.04 4.99 2.65 4.01 4.81 6.18 4.47 2.77 3.44 2.46 2.04 1.65 1.10 49.64 1803 1027 579 609 953 1155 827 501 633 441 361 357 219 9595 18.79 10.70 6.02 7.69 9.92 12.03 8.61 5.21 6.58 4.59 3.75 3.75 2.33 100.0 1.82 0.16 34.21 76.48 22.31 12.39 147.37 1.24 0.11 23.21 51.90 15.14 8.40 100 @ IJTSRD | Unique Reference Paper ID – IJTSRD21395 | Volume – 3 | Issue – 2 | Jan-Feb 2019 Page: 381
International Journal of Trend in Scientific Research and Development (IJTSRD) @ www.ijtsrd.com eISSN: 2456-6470 MEANS OF WASTE DISPOSAL Table5. Means of Waste Disposal in the Study Area Means of waste disposal Dump - site Burning of waste Dust bin Total Source, field survey, 2017 Population Percentage 6329 2424 842 9595 65.96 25.26 8.78 100 Figure 6: The existing land use of the study area From Fig. 6, the study shows that public/semi-public land use has the highest percentage due to the presence of the police barrack and national immigration service in the study area. The commercial and recreational land uses has the smallest percentage. Therefore, there is need to pave ways for more commercial and recreational land use to serve the residents of the study area more efficiently. DISTANCE TO SCHOOL Dump Burning Dust Figure 9: A pie chart showing means of waste disposal From the survey carried out, Fig. 9 shows that 65.96% dump their waste, 25.26% burn their waste and 8.76% uses dust- bin. This shows the poor management of refuse which will lead to unhealthy environment both in terms of aesthetics and air quality. SOURCES OF WATER SUPPLY IN THE STUDY AREA Source of water supply None Well Borehole Tap Total Source, field survey, 2017 BUILDING AGE Population 200 1125 3950 4520 9595 Percentage 2.08 11.72 41.16 47.10 100 Figure 7: The distance to school in the study area From Fig. 7, it shows that the distance from schools to individual household are adequately distributed according to planning standard for a residential neighborhood plan [4]. DISTANCE TO HEALTH FACILITIES Figure 10: Map showing the Building Age of the study area Figure 8: The distance to health facilities in the study area. Fig. 8 shows that the distance from health facilities to individual household are adequately distributed according to planning standard for a residential neighborhood plan [5]. Fig. 10 above map shows the weighted score of the building age in the study area. Buildings ranging from 0-20 years, 21- 40 years, and 41-68 years this may help in the condition of the houses in the area. @ IJTSRD | Unique Reference Paper ID – IJTSRD21395 | Volume – 3 | Issue – 2 | Jan-Feb 2019 Page: 382
International Journal of Trend in Scientific Research and Development (IJTSRD) @ www.ijtsrd.com eISSN: 2456-6470 BUILDING CONDITION D.Distance to school The criteria used in this study to determine individual household to school includes the following; 0-400m ,400- 800m ,800- above(standard to determine school distance radius in a residential neighborhood plan) [4].Therefore, the school are adequately distributed. E.Distance to Health facilities The criteria used in this study to determine individual household to health facilities includes the following; 0-400m ,400-800m ,800- above(standard to determine health facilities distance radius in a residential neighborhood plan)[4].Therefore, the health facilities are adequately distributed. F.Means of waste disposal 65.96% of the total population disposes waste by means of dump-site.25.26% of the total population disposes waste by means of burning of waste.8.78% of the total population disposes waste by means of dust-bin. PLAN PROPOSAL Figure 11: Map showing the building condition of the study area. Based on Fig. 11, the weighted score of the building condition in the study area is 3 good (periodic maintenance), 2 fair (low level of maintenance), 1 bad (no maintenance). INCOME LEVEL Figure 13: The proposed land use of the study area Figure 12: The income level of the study area. Fig. 12 map shows the income level of the study area. The study area is mostly dominated by average income earners. SUMMARY OF FINDINGS To achieve the goal of renewal, various variables were adopted and the following forms the summary of findings. A.Population The survey shows that the study area has a total population of 9595 with a total land area of 147.7 hectares of land, with 4832 as males accounting for 50.36%, female accounts for 4763 representing 49.64%. B.Existing Land Use The survey shows that public/semi-public lands use dominate other land uses due to the presence of the police barrack and national immigration service. Commercial and recreational land uses has the smallest percentage in the study area. Therefore, there is need to pave ways for these land uses in the study area. C.Road and Circulation 80% of the Access road is untarred. Figure 14: The proposed road network for the study area Figure 15: The proposed urban renewal plan @ IJTSRD | Unique Reference Paper ID – IJTSRD21395 | Volume – 3 | Issue – 2 | Jan-Feb 2019 Page: 383
International Journal of Trend in Scientific Research and Development (IJTSRD) @ www.ijtsrd.com eISSN: 2456-6470 PLAN IMPLEMENTATION This is the execution of a plan, design and model. The success of any plan lies on its implementation meaning that a plan only becomes a plan when it is translated physically on the ground. Thus, the various bodies responsible for implementation of the proposals made in this study area specified in the table below Figure 16: Proposed urban renewal plan (3d design) Table7. Table showing the plan implementation PROJECT Education and enlightenment of people of Yelwan Tudu on issues of urban renewal Relocation of people willing to relocate Land acquisition and compensation Reconstruction of access roads Provision of water supply Enlightenment on Refuse collection Provision of commercial and recreational facilities Bauchi state urban planning and development Board Completion of development Bauchi state urban planning and development Board IMPLEMENTATION BODY Bauchi state Ministry of information Bauchi state urban planning and development board Bauchi state urban planning and development board Bauchi Ministry of works Bauchi state Water Board Bauchi state environmental agency PHASING OF PLAN IMPLEMENTATION The plan implementation for the study area is a 10 years plan (2017-2027) grouped into two phases I (2017-2022) and II (2022-2027). TABLE8. Table Showing the Phases of Plan Implementation PHASE PROJECT Education and enlightenment of people of Yelwan Tudu on urban renewal issues Land acquisition and compensation Construction of untarred access roads Provision of water source TWO(II) 2022 2027 Enlightenment and provision of waste bins Provision of commercial and Recreational facilities 2023 2025 Completion of development SOURCES OF FUNDS FOR IMPLEMENTATION The success of every plan implementation depends on the financial source and commitment. For the purpose of this plan, the following sources are identified for the implementation of the project. ?Federal Government of Nigeria (Special Intervention) ?Bauchi state Government ?Bauchi Local Government Council ?Non-governmental Organization ?World Bank Assisted Project ?Private Sector Intervention ?Community Based Organization CONCLUSION The analysis of various variables using the GIS platform has been demonstrated in this research paper to be an excellent response to the methodological shortcomings of conventional tools. Urban renewal studies usually generate large volumes of data which the manual methods of analysis PERIOD ONE(I) 2017 2022 2017 2017- 2018 2019 2021 2022 2022 2025 2027 cannot handle. The GIS technique explored in this study showed strengths in terms of analytical precision, accuracy of results, timeliness and display of results in the form of maps that the conventional methods cannot provide. REFERENCES [1]Egolum C. C., Emoh F. I., (2017). The issues and challenges of urban renewal in a developing economy. International journal of development and economic sustainability. 5 (1): 32-44 [2]Omole, F. K. (2000). Urban Renewal Process Issues and Strategies; Concept Books and Publication Company Nig. Limited, Lagos, Nigeria. [3]Uloko, C. E. and J. E Agbonoga, (2005). An Essential Handbook for Physical Planners .Kaduna, Alex. [4]Obateru O.I. (1968). Land Subdivision; Evans Brothers (Nig) Publishers. Ltd. @ IJTSRD | Unique Reference Paper ID – IJTSRD21395 | Volume – 3 | Issue – 2 | Jan-Feb 2019 Page: 384


![Geographic Information System [GIS]](https://cdn2.slideserve.com/5315378/geographic-information-system-gis-dt.jpg)