Download
1 / 5
50 likes | 67 Vues
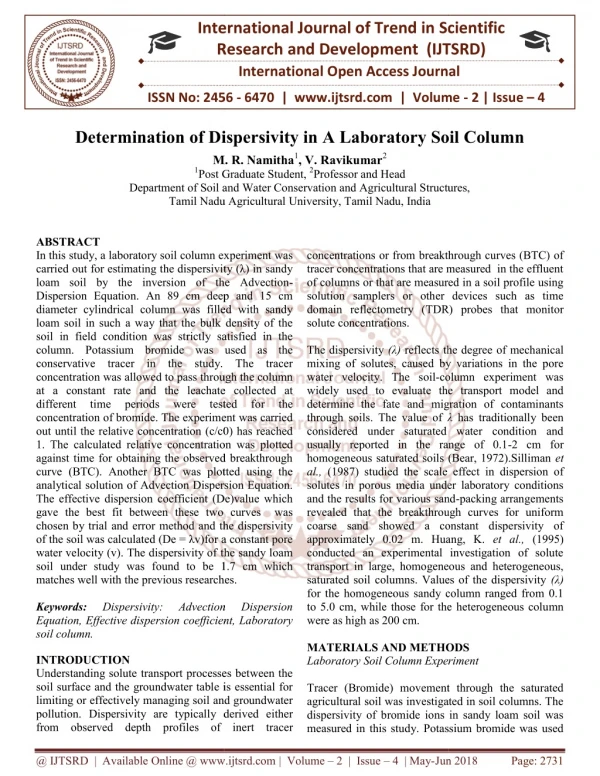
In this study, a laboratory soil column experiment was carried out for estimating the dispersivity in sandy loam soil by the inversion of the Advection Dispersion Equation. An 89 cm deep and 15 cm diameter cylindrical column was filled with sandy loam soil in such a way that the bulk density of the soil in field condition was strictly satisfied in the column. Potassium bromide was used as the conservative tracer in the study. The tracer concentration was allowed to pass through the column at a constant rate and the leachate collected at different time periods were tested for the concentration of bromide. The experiment was carried out until the relative concentration c c0 has reached 1. The calculated relative concentration was plotted against time for obtaining the observed breakthrough curve BTC . Another BTC was plotted using the analytical solution of Advection Dispersion Equation. The effective dispersion coefficient De value which gave the best fit between these two curves was chosen by trial and error method and the dispersivity of the soil was calculated De = v for a constant pore water velocity v . The dispersivity of the sandy loam soil under study was found to be 1.7 cm which matches well with the previous researches. M. R. Namitha | V. Ravikumar "Determination of Dispersivity in A Laboratory Soil Column" Published in International Journal of Trend in Scientific Research and Development (ijtsrd), ISSN: 2456-6470, Volume-2 | Issue-4 , June 2018, URL: https://www.ijtsrd.com/papers/ijtsrd14580.pdf Paper URL: http://www.ijtsrd.com/engineering/agricultural-engineering/14580/determination-of-dispersivity-in-a-laboratory-soil-column/m-r-namitha<br>

E N D
International Research Research and Development (IJTSRD) International Open Access Journal of Dispersivity in A Laboratory Soil Column M. R. Namitha1, V. Ravikumar2 Post Graduate Student, 2Professor and Head Department of Soil and Water Conservation and Agricultural Structures, Tamil Nadu Agricultural University, Tamil Nadu, India concentrations or from breakthrough curves (BTC) of tracer concentrations that are measured in the effluent of columns or that are measured in a soil profile using solution samplers or other devices such as time domain reflectometry (TDR) probes th solute concentrations. The dispersivity (λ) reflects the degree of mechanical mixing of solutes, caused by variations in the pore water velocity. The soil-column experiment was widely used to evaluate the transport model and determine the fate and migration of contaminants through soils. The value of λ considered under saturated water condition and usually reported in the range of 0.1 homogeneous saturated soils (Bear, 1972).Silliman al., (1987) studied the scale effect in dispersion of solutes in porous media under laboratory conditions and the results for various sand revealed that the breakthrough curves for uniform coarse sand showed a constant dispersivity of approximately 0.02 m. Huan conducted an experimental investigation of solute transport in large, homogeneous and heterogeneous, saturated soil columns. Values of the dispersivity for the homogeneous sandy column ranged from 0.1 to 5.0 cm, while those for the were as high as 200 cm. MATERIALS AND METHODS Laboratory Soil Column Experiment Tracer (Bromide) movement through the saturated agricultural soil was investigated in soil columns. The dispersivity of bromide ions in sandy loam soil was measured in this study. Potassium bromide was used measured in this study. Potassium bromide was used International Journal of Trend in Scientific Scientific (IJTSRD) International Open Access Journal ISSN No: 2456 ISSN No: 2456 - 6470 | www.ijtsrd.com | Volume 6470 | www.ijtsrd.com | Volume - 2 | Issue – 4 Determination of Dispersivity i n A Laboratory Soil Column M. R. Namitha 1Post Graduate Department of Soil and Water Conservation and Agricultural Structures, Tamil Nadu Agricultural University Department of Soil and Water Conservation and Agricultural Structures, ABSTRACT In this study, a laboratory soil column experiment was carried out for estimating the dispersivity (λ) in sandy loam soil by the inversion of the Advection Dispersion Equation. An 89 cm deep and 15 cm diameter cylindrical column was filled with sandy loam soil in such a way that the bulk density of the soil in field condition was strictly satisfied in the column. Potassium bromide was used as the conservative tracer in the study. The tracer concentration was allowed to pass through the column at a constant rate and the leachate collected at different time periods concentration of bromide. The experiment was carried out until the relative concentration (c/c0) has reached 1. The calculated relative concentration was plotted against time for obtaining the observed breakthrough curve (BTC). Another BTC was plotted using the analytical solution of Advection Dispersion Equation. The effective dispersion coefficient (De)value which gave the best fit between these two curves was chosen by trial and error method and the dispersivity of the soil was calculated (De = λv)for a constant pore water velocity (v). The dispersivity of the sandy loam soil under study was found to be 1.7 cm which matches well with the previous researches. Keywords: Dispersivity: Equation, Effective dispersion coefficient, Laboratory soil column. INTRODUCTION Understanding solute transport processes between the soil surface and the groundwater table is essential for limiting or effectively managing soil and groundwater pollution. Dispersivity are typically derived either from observed depth profiles of inert tr from observed depth profiles of inert tracer In this study, a laboratory soil column experiment was carried out for estimating the dispersivity (λ) in sandy loam soil by the inversion of the Advection- Dispersion Equation. An 89 cm deep and 15 cm diameter cylindrical column was filled with sandy loam soil in such a way that the bulk density of the soil in field condition was strictly satisfied in the column. Potassium bromide was used as the conservative tracer in the study. The tracer n was allowed to pass through the column at a constant rate and the leachate collected at different time periods concentration of bromide. The experiment was carried out until the relative concentration (c/c0) has reached ted relative concentration was plotted against time for obtaining the observed breakthrough curve (BTC). Another BTC was plotted using the analytical solution of Advection Dispersion Equation. The effective dispersion coefficient (De)value which est fit between these two curves was chosen by trial and error method and the dispersivity of the soil was calculated (De = λv)for a constant pore water velocity (v). The dispersivity of the sandy loam soil under study was found to be 1.7 cm which well with the previous researches. concentrations or from breakthrough curves (BTC) of tracer concentrations that are measured in the effluent of columns or that are measured in a soil profile using solution samplers or other devices such as time domain reflectometry (TDR) probes that monitor reflects the degree of mechanical mixing of solutes, caused by variations in the pore column experiment was widely used to evaluate the transport model and and migration of contaminants were were tested tested for for the the λ has traditionally been considered under saturated water condition and usually reported in the range of 0.1-2 cm for homogeneous saturated soils (Bear, 1972).Silliman et ale effect in dispersion of solutes in porous media under laboratory conditions and the results for various sand-packing arrangements revealed that the breakthrough curves for uniform coarse sand showed a constant dispersivity of approximately 0.02 m. Huang, K. et al., (1995) conducted an experimental investigation of solute transport in large, homogeneous and heterogeneous, saturated soil columns. Values of the dispersivity (λ) for the homogeneous sandy column ranged from 0.1 to 5.0 cm, while those for the heterogeneous column Dispersivity: Advection Advection Dispersion Dispersion Equation, Effective dispersion coefficient, Laboratory MATERIALS AND METHODS Laboratory Soil Column Experiment Understanding solute transport processes between the soil surface and the groundwater table is essential for limiting or effectively managing soil and groundwater pollution. Dispersivity are typically derived either Tracer (Bromide) movement through the saturated agricultural soil was investigated in soil columns. The dispersivity of bromide ions in sandy loam soil was @ IJTSRD | Available Online @ www.ijtsrd.com @ IJTSRD | Available Online @ www.ijtsrd.com | Volume – 2 | Issue – 4 | May-Jun 2018 Jun 2018 Page: 2731
International Journal of Trend in Scientific Research and Development (IJTSRD) ISSN: 2456-6470 as the conservative tracer. Bromide salts have proven to serve as excellent tracer materials since they are highly soluble, non-degradable, inexpensive, and can be measured quantitatively in very low concentrations. A cylindrical laboratory soil column of 89 cm height and 15 cm diameter (Fig. 1) was used to find the dispersion of potassium bromide tracer in a homogeneously packed sandy loam soil. The bulk density of the soil measured using core cutter method was found to be 1.58 g cm-3. The soil column was filled in such a way that the bulk density of the soil in the field was strictly satisfied in the laboratory soil column. ???? ??????? ???????? ??????? (4) ???????? = 1 − The uniform soil column was saturated initially by passing water through it. The potassium bromide (KBr) solution having an initial concentration of 20 g per 200 ml of tap water was allowed to pass through the soil column from its upper end and the leachate was collected at the lower end. The input solution was given at a constant rate of 800 cm3 h-1 throughout the experiment. Since a constant input of solute at a given concentration (c0) was given at the surface boundary, this is known as step input. Concentration of bromide ions in the leachate collected at different time steps were determined by Mohr’s (Argentometric titration) method. Mechanism of solute transport in soils `The solute conservation equation states that the change in total solute concentration (CT) in units of mass per volume of soil in a representative elementary volume over time is equal to the negative of the rate of change of the solute flux with depth, minus any source/ sink (S) in units of mass per volume per time (Radcliff and Simunek, 2010). Only solute flow in the vertical direction (z positive up) is considered for simplification purposes. ??? ??= −??? where, CTis the total solute concentration in units of mass per volume of soil, S is the source/ sinks in units of mass per volume per time and,?? is the total solute flux. This is the partial differential equation (PDE) with independent variables z and t and the dependent variable CT. The units of each term are [ML-3T-I]. Solute flux (??) is the rate at which the solute flows through a given cross-sectional area. The total solute concentration (CT) consists of the dissolved or liquid-phase solute concentration (c), expressed as a mass of solute per volume of liquid, and the adsorbed or solid-phase solute concentration (s), expresses as a mass of solute per mass of soil. To convert each of these concentrations to units of mass per volume of soil, c is multiplied by θ and s is multiplied by??. ??= ?? + ??? where, c is theliquid-phase solute concentration [ML- 3], s is the solid-phase solute concentration [MM-1], θ relatively ??− ? (5) Fig. 1: Laboratory Soil Column Experimental Setup ?????? ?? ?ℎ? ???? ??????, ? = ???ℎ = ?x(7.5)?x(89) = 15719.63 ??? ???? ??????? ?? ?ℎ? ???? (??) = where, M is the mass of the soil, g and, V is the volume of soil, cm3. ???? ?? ?ℎ? ???? ?? ?? ?????? ?? ?ℎ? ???? ??????, ? = ?? x ? =1.58 x 15719.63 = 24837.01 g = 24.84 kg i.e. for satisfying the bulk density of the soil (1.58 g cm-3), 24.84 kg of soil was filled in the soil column providing an additional free board of 1 cm at the top. The porosity of the soil was found to be 0.37 (Eq. 4). (1) ? ? (2) (3) (6) @ IJTSRD | Available Online @ www.ijtsrd.com | Volume – 2 | Issue – 4 | May-Jun 2018 Page: 2732
International Journal of Trend in Scientific Research and Development (IJTSRD) ISSN: 2456-6470 is the volumetric water content [L3L-3] and,?? is the bulk density of soil [ML-3]. Solute flux in the liquid consists of three components that represent different transport processes: advective (also called convective) flux (JIc), diffusive flux (JId) and hydrodynamic dispersive flux (JIh). ??= ???+ ???+ ??? (7) Advection Dispersion (Convection- Dispersion) Equation Most mechanistic transport models for solutes in porous materials are based on the convection- dispersion equation (CDE). The CDE is a partial differential equation representing mass continuity for movement of a given solute in a porous medium by dispersion and convection under specified initial and boundary conditions. Appropriate terms are incorporated into to the CDE to account for chemical and/or physical sink/source interactions between the solute and porous medium. The CDE can be developed microscopically based on Brownian motion, or macroscopically, based on Fick’s law. The final solution to the Advection-Dispersion equation obtained by the Laplace transform method is: ?(?,?) where, λ is the dispersivity, [L] and, v is the pore water velocity, [LT-1]. Determination of Bromide Ion Concentration by Argentometric Titration (Mohr’s method) Mohr’s method determines the bromide ion concentration of a solution by titration with silver nitrate (AgNO3). As the silver nitrate solution is slowly added, a precipitate of silver bromide forms. Ag+ (aq) + Br–(aq)→ AgBr(s) The end point of the titration occurs when all the bromide ions were precipitated. Then additional silver ions react with the chromate ions of the indicator, potassium chromate, to form a red-brown precipitate of silver chromate. 2 Ag+ (aq)+ CrO4 The pH of the sample solutions should be between 7 and 10 because chromate ion is the conjugate base of the weak chromic acid. A suitable pH was achieved by saturating the analyte solution with sodium hydrogen carbonate (NaHCO3). Although the silver bromide that forms is a white precipitate, the chromate indicator initially gives the cloudy solution a faint lemon-yellow colour. The endpoint of the titration was identified as the first appearance of a red-brown colour of silver chromate. The titration was repeated with further aliquots of diluted samples until concordant results were obtained. A blank titration is carried out by titrating a fixed and known concentration of titrant into a solvent with zero analyte. The only difference from the regular titration is the absence of analyte. This allows the amount of reactive substance within the plain solvent to be determined and hence allows a determination of the error in future titration experiments using this solvent.The blank titration was conducted to correct the errors that might occur in the titre values due to the presence of chloride impurities in the potassium chromate indicator.The volume of AgNO3 needed for the complete precipitation of the bromide ions (titre value) was noted and the concentration of bromide ions in the leachate was calculated using the following equation: (?????) ? ??????? ???????????????? ????? ???.????????????? 2– (aq)→ Ag2CrO4(s) exp?−(? − ??)? = ??????? ? ??? 4??? 2 ?????? − ?? −1 + 1 ?4???? 2?1 +?? ?? +??? ?? ?exp??? ????????? + ?? ?4????? (8) where, erfc is the complementary error function defined as ????(?) = concentration at depth z at time t [ML-3], c0 is the initial concentration [ML-3], De is the effective dispersion coefficient [L2T-1], v is the pore water velocity [LT-1], z is the depth [L] and, t is the time [T]. Effective dispersion coefficient, ??= ?? ∞ ? √?∫ ???? ? ??, c is the ? = (10) (9) @ IJTSRD | Available Online @ www.ijtsrd.com | Volume – 2 | Issue – 4 | May-Jun 2018 Page: 2733
International Journal of Trend in Scientific Research and Development (IJTSRD) ISSN: 2456-6470 the soil column in cm2. The pore water velocity(v) was calculated as 12.24 cm h-1 (i.e. 293.79 cm d-1). The BTC for observed bromide concentration was obtained using Eq. 10 and the resulting plot was fitted to the solution of 1-D ADE (Eq. 8). The effective dispersion coefficient (De) which gives the best fit between the observed and predicted BTC’s was chosen by trial and error method. Finally, the dispersivity (λ) for the bromide ions in the sandy loam soil column at a depth of 89 cm was calculated using Eq. 9. RESULTS AND DISCUSSIONS The hydrodynamic dispersion coefficient (De) and the pore water velocity (v) were derived from depth profile (89 cm) assuming that v and De are constant in the soil profile and do not change with depth and time, i.e. a hydro dynamically homogeneous soil profile and steady state flow conditions. The analytical solutions of the solute transport equation (ADE) was derived and fitted to the observed BTCs. where, c is the concentration of bromide in the leachate in mg l-1, ?? is the volume of AgNO3 needed for the sample in ml, VB is the volume of AgNO3 needed for the blank in ml (0.2 ml) and,MAgNO3 is themolarity of AgNO3 (0.1M). The equivalent weight of bromide is 79.9 g. The concentration (c) of the leachate and the relative concentrations (c/c0) for different time steps were calculated using Eq. 10. Once the concentration of the leachate was calculated, a graph was plotted with the relative (c/c0) against the time (t). This graph is said to be the observed breakthrough curve. Break Through Curves (BTCs) The concentrations can be plotted as a function of time at a given depth for various values of effective dispersion coefficient (De) and the plots are called breakthrough curves (BTC). Break through curves are extensively used to characterize the physicochemical processes involved in the transport of solutes in porous media. Analysis of column BTCs can provide useful estimates of the parameters for the physicochemical processes involved in subsurface solute transport (Radcliff and Simunek, 2010). Such parameters are essential for developing and validating theoretical models for solute transport. The relative concentration (c/c0) obtained from the Advection-Dispersion Equation (Eq. 8) was plotted against corresponding time periods (t) to generate the BTC (predicted) at 89 cm depth. Microsoft excel was effectively utilised to concentration values. Excel allows the user to calculate the complementary error function directly. The effective dispersion coefficient is a constant, rather than a function of time or mean travel distance (Dagan, 1988; Neuman and Zhang, 1990; Rajaram and Gelhar, 1993). The effective dispersion coefficient (De) in Eq. (8) was chosen arbitrarily by trial and error method. The pore water velocity (v) was calculated as: ? = where, ? is the porosity and,?? is the Darcy velocity. ??= where, Q is the constant discharge rate of the step input (800 cm3h-1) and A is the input surface area of 1.2 1 0.8 c/c0 0.6 0.4 c/c0 0.2 0 0 0.2 0.4 0.6 calculate the relative Time (days) Fig. 2: Relative Concentration vs. Time curve obtained from the estimated bromide concentration An initial concentration of 20 g per 200 ml of potassium bromide was given as the input tracer solution. Initially, the concentration of bromide was 0 in the leachate and as time passes the bromide starts to appear in the leachate. The first appearance of bromide was found 43 minutes after the starting of the experiment. The concentration of bromide in the leachate increased with time and reached 100 % concentration after 12.25 hrs. The bromide concentration of the leachate (c) estimated using Mohr’s test was determined by Eq. (10) and the relative concentration (c/c0) for different ?? ? (11) ? ? (12) @ IJTSRD | Available Online @ www.ijtsrd.com | Volume – 2 | Issue – 4 | May-Jun 2018 Page: 2734
International Journal of Trend in Scientific Research and Development (IJTSRD) ISSN: 2456-6470 Summary and Conclusion The determination of various solute transport parameters is important mainly in the groundwater pollution studies. In present study, the dispersivity of bromide ions in a laboratory soil column was determined by the inversion of Advection-Dispersion Equation. The dispersivity of the bromide ions in a homogeneous sandy loam soil column was found to be 1.7 cm. REFERENCES 1.Bear, J. 1972. Dynamics of Fluids in Porous Media. American Elsevier Pub. Co. time steps were calculated. The observed BTC (Fig. 2) in the homogeneous sandy loam column was found to be a smooth and sigmoidal (S-shaped) curve. After about 6.67 hrs, the relative concentration reached a value of 0.5 and half of the BTC had arrived. Eventually, concentration concentration at 12.25 hrs. At this point, solute has arrived at this depth even in the smallest pores. The effective dispersion coefficient (De) and dispersivity (λ) were determined by fitting the analytical solution of the convection-dispersion equation (Eq. 8) to the BTC obtained by estimated relative concentration. The solution of 1-D ADE was fitted to the locally measured BTC by randomly changing the value of effective dispersion coefficient (De) by trial and error method. Since the dispersion of the solute front was affected by De, so was the BTC. As De increased, the BTC became more dispersed. reached the input 2.Radcliff, D. E., and J. Simunek. 2010. Soil Physics with Hydrus: Modeling and Applications. CRC Press: 183-347. 3.Dagan, G. 1988. Theory of Solute Transport by Groundwater. Annual Mechanics 19: 183-215. Reviews of Fluid 4.Neuman, S. P., and Y. K., Zhang. 1990. A Quasi- Linear Theory of Non-Fickian and Fickian Subsurface Dispersion: 1. Theoretical Analysis with Application to Isotropic Media. Water Resour. Res. 26(5): 887-902. 5.Rajaram, H., and L. W. Gelhar. 1993. Plume-scale dependent dispersion in heterogeneous aquifers: 2. Eulerian analysis and three-dimensional aquifers. Water Resour. Res. 29(9): 3261–3276. 6.Silliman, S. E. and, E. S. Simpson. 1987. Laboratory evidence of the scale effect in dispersion of solutes in porous media. Water Resour. Res. 23(8): 1667-1673. Fig. 3: Observed and Fitted BTC using ADE Fig. 3 shows the curves fitted using Microsoft Excel. The average pore water velocity was assumed to be a constant of 293.79 cm d-1throughout the soil profile. The best fit between the two curves were obtained when De value was set to 500 cm2 d-1. The longitudinal dispersivity (λ) was calculated using Eq. 9. The value of dispersivity (λ) for bromide at the depth of 89 cm for the proposed sandy loam was calculated as 1.70 cm. This value lies well within the range (0.1-2 cm) reported for homogeneous saturated soils in laboratory column experiments (Bear, 1972). 7.Huang, K., N. Toride, and M. Th. van Genuchten. 1995. Experimental investigation of solute transport in large, heterogeneous, saturated soil columns. Transport in Porous Media 18: 283-302. homogeneous and @ IJTSRD | Available Online @ www.ijtsrd.com | Volume – 2 | Issue – 4 | May-Jun 2018 Page: 2735