Download
1 / 8
120 likes | 139 Vues
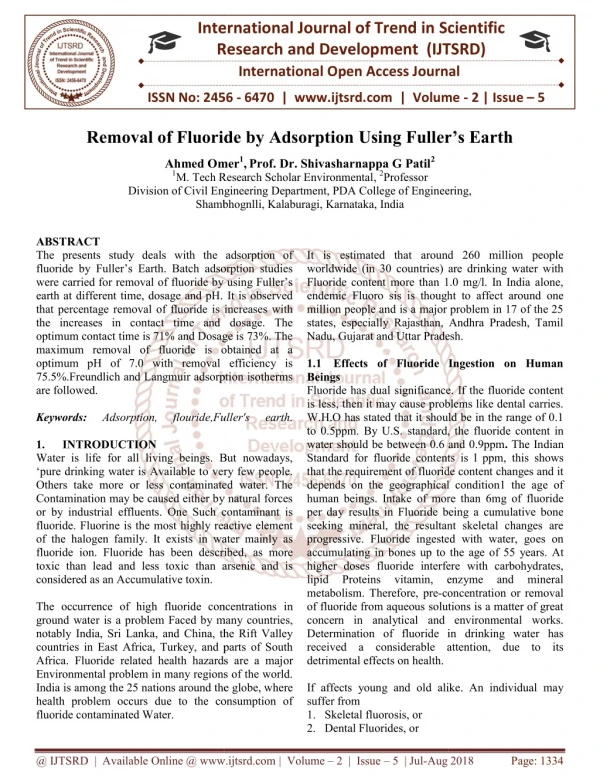
The potential of Thespesia Populnea Seed TPS powder, for the removal of Congo red 4B CR dye from aqueous solution was investigated. The adsorbent was characterized by FTIR and SEM analysis. Batch adsorption studies were conducted and various parameters such as pH, adsorbent dosage, initial dye concentration, contact time and temperature were studied to observe their effects in the dye adsorption process. The optimum conditions for the adsorption of Congo red 4B onto the adsorbent TPS was found to be contact time 75 min 1, pH 3, temperature 303K for an initial dye concentration 22 mg L and adsorbent dosage 0.12gm. The experimental equilibrium adsorption data fitted to the Langmuir isotherm and Freundlich isotherm model. The kinetic data conformed to the Pseudo second order kinetic model, suggesting that the rate limiting steps may be chemisorptions. Thermodynamic quantities such as Gibbs free energy G0, enthalpy H0 and entropy S0 were evaluated. The negative values of G0 and the negative value of H0 obtained indicated the spontaneous and exothermic nature of the adsorption processes while the negative S0 value obtained decreased randomness during the adsorption process. R. Bhuvaneswari | K. Arivalagan | Subramanian Sivanesan "Dye Removal of Adsorption Study in Thespesia Populnea Seed" Published in International Journal of Trend in Scientific Research and Development (ijtsrd), ISSN: 2456-6470, Volume-2 | Issue-1 , December 2017, URL: https://www.ijtsrd.com/papers/ijtsrd5956.pdf Paper URL: http://www.ijtsrd.com/engineering/electronics-and-communication-engineering/5956/dye-removal-of-adsorption-study-in-thespesia-populnea-seed/r-bhuvaneswari<br>

E N D
International Research Research and Development (IJTSRD) International Open Access Journal International Open Access Journal International Journal of Trend in Scientific Scientific (IJTSRD) ISSN No: 2456 ISSN No: 2456 - 6470 | www.ijtsrd.com | Volume | www.ijtsrd.com | Volume - 2 | Issue – 1 Dye Removal of Adsorption Study i Dye Removal of Adsorption Study i Thespesia Populnea Seed Dye Removal of Adsorption Study in R. Bhuvaneswari Research scholar, Dept. of Chemistry, Govt. Arts College for Men, Nandanam,Chennai, India K. Arivalagan Assistant Professor, Dept. of Subramanian Sivanesan Head of the Dept. of Applied Science and Technology, AC College of Technology, Anna niversity, Chennai, India Subramanian Sivanesan Head of the Dept. of Applied Science and Technology, College of Technology, Anna University, Chennai, India Chemistry, Govt. Arts College for Chemistry, Govt. Arts College for Men, Nandanam,Chennai, India ABSTRACT The potential of Thespesia Populnea Seed (TPS) powder, for the removal of Congo red 4B (CR) dye from aqueous solution was investigated. The adsorbent was characterized by FTIR and SEM analysis. Batch adsorption studies were conducted and various parameters such as pH, adso initial dye concentration, temperature were studied to observe their effects in the dye adsorption process. The optimum conditions for the adsorption of Congo red 4B onto the adsorbent TPS was found to be contact time 75 min temperature 303K for an initial dye concentration 22 mg/L and adsorbent dosage 0.12gm. The experimental equilibrium adsorption data fitted to the Langmuir isotherm and Freundlich isotherm model. The kinetic data conformed to the Pseudo second orde model, suggesting that the rate limiting steps may be chemisorptions. Thermodynamic quantities such as Gibbs free energy ∆G0, enthalpy ∆H0 and entropy were evaluated. The negative values of negative value of ∆H0 obtained indicated spontaneous and exothermic nature of the adsorption processes while the negative ∆S0 value obtained decreased randomness during the adsorption process. Keywords: Adsorption ,Thespesia Populnea seed, Congo red 4B INTRODUTION economic if the adsorbent used is available and cheep in cost. Thespesia Populanea (Malvaceae) is a large tree found in tropical regions and coastal forests of . Various parts of T. Populanea are found to possess useful medicinal properties, such as antibacterial, antioxidant, purgative, anti fertility, anti- economic if the adsorbent used is available and cheep in cost. Thespesia Populanea (Malvaceae) is a large tree found in tropical regions and coastal forests India opine 1. Various parts of T. Populanea are found to possess useful medicinal properties, such as antibacterial, antioxidant, purgative, anti fertility, anti inflammatory and heap to protective active opine Moreover, all the parts of the TPS pla used in traditional system of medicine. Industries manufacturing dye and dye intermediates are the largest sector of chemical industries in India. There is a variety of dyes like acid dyes, basic dyes, azo dyes, mordent dyes, plastic dyes, etc these industries thus contain dyes as main pollutant 6. Dye contaminated waste water originates from various industries such as textile, leather, food, dyeing, cosmetics etc. consequently, there is a considerable need for the removal effluents prior to their discharge in to receiving water 7. A huge amount of water us necessary by these industries for the cleaning and washing purpose and they discharge highly colored effluents containing different dyes. Many investig feasibility of inexpensive alternative material like pear millet husk, date pits, sawdust, buffing dust of leather industry, coir pith, crude oil residue tropical grass, olive stone and almond shells, pines bark, wood waste, coconut shell, etc., as carbonaceous precursors, for the removal of dyes from water and waste water. Present study Congo red 4B is one of the types of acid dyes. Congo red 4B is a heterocyclic aromatic chemical compound with chemical compound with Thespesia Populnea Seed (TPS) powder, for the removal of Congo red 4B (CR) dye from aqueous solution was investigated. The adsorbent was characterized by FTIR and SEM analysis. Batch adsorption studies were conducted and various parameters such as pH, adsorbent dosage, initial dye concentration, temperature were studied to observe their effects in the dye adsorption process. The optimum conditions for the adsorption of Congo red 4B onto the adsorbent TPS was found to be contact time 75 min-1, pH 3, temperature 303K for an initial dye concentration 22 mg/L and adsorbent dosage 0.12gm. The experimental equilibrium adsorption data fitted to the Langmuir isotherm and Freundlich isotherm model. The kinetic data conformed to the Pseudo second order kinetic model, suggesting that the rate limiting steps may be chemisorptions. Thermodynamic quantities such as protective active opine2. contact contact time time and and Moreover, all the parts of the TPS plant have been used in traditional system of medicine. Industries manufacturing dye and dye intermediates are the largest sector of chemical industries in India. There is a variety of dyes like acid dyes, basic dyes, azo dyes, mordent dyes, plastic dyes, etc. The effluents from these industries thus contain dyes as main pollutant 3- . Dye contaminated waste water originates from various industries such as textile, leather, food, dyeing, cosmetics etc. consequently, there is a considerable need for the removal of dye from water effluents prior to their discharge in to receiving water . A huge amount of water us necessary by these industries for the cleaning and washing purpose and they discharge highly colored effluents containing different dyes. Many investigators have studied the feasibility of inexpensive alternative material like pear millet husk, date pits, sawdust, buffing dust of leather industry, coir pith, crude oil residue tropical grass, olive stone and almond shells, pines bark, wood shell, etc., as carbonaceous precursors, for the removal of dyes from water and waste water. Present study Congo red 4B is one of the types of acid dyes. Congo red 4B is a heterocyclic aromatic and entropy ∆S0 were evaluated. The negative values of ∆G0 and the obtained indicated the spontaneous and exothermic nature of the adsorption value obtained decreased randomness during the adsorption process. : Adsorption ,Thespesia Populnea seed, Adsorption technique is by far the most versatile and widely used moreover, this processes become widely used moreover, this processes become Adsorption technique is by far the most versatile and molecular molecular formula formula @ IJTSRD | Available Online @ www.ijtsrd.com @ IJTSRD | Available Online @ www.ijtsrd.com | Volume – 2 | Issue – 1 | Nov-Dec 2017 Dec 2017 Page: 320
International Journal of Trend in Scientific Research and Development (IJTSRD) ISSN: 2456-6470 C32N22N6Na2O6S2 fig. 1 Shows the structure of Congo red 4B, its chemical name is sodium salt of Benzidine azo-bis- napthaylamine-4 sulfonic acid and molecular weight is 696.66 g/mol. Due to color change from blue to re at pH 3-5 can be used as pH indicator. Preparation of Adsorbate Solution: Analytical grade Congo red 4B dye (C32N22N6Na2O6S2) Molecular weight 696.68g/mol λ max=495nm was obtained from the UV-spectrophotometer (Shimadaz UV-1800) from Anna University (EM laboratory). Purchased Avara synthesis Pvt.Ltd. Low cost adsorbent. A stock solution Congo red 4B dye of concentration 100 mg/L was prepared by dissolving of 0.1g of powder adsorbate dye in 1L standard flask filled with distilled water. Experimental dye solution of desired concentration was obtained by appropriate dilution of the stock solution. Correlation coefficient value of dye concentration 100 mg/L value (R2=0.997). Batch Adsorption Experiments Batch adsorption of Congo red 4B dye onto the adsorbent TPS was conducted in a 250ml conical flask containing 40ml of known concentration of the CR dye solution and accurately weighed amount of the adsorbents. The mixtures in the flask were agitated on a mechanical shaker at a constant speed of 250 rpm. The effect of contact time (30, 45, 60 and 75) min-1, Adsorbent dosage (0.08, 0.10, 0.12 and 0.14) gm, Initial dye concentration (22, 24, 26, 28 and 30) mg/L, pH (3, 4, 5, 6, 7 and 8) and Temperature (303, 313, 323 and 333) K were evaluated. The flask containing the samples were withdrawn from the shaker at predominant time intervals, filtered and the final concentration of CR dye was determining using the equation. The dye uptake capacity for each sample was calculated according to a mass balance using equation (1) Fig. 1 Structure of Congo red 4B dye In the presence of color in the water bodies reduce light penetration which in turn upsets the biological metabolism process, disposal of dye waste water without proper treatment destructed the aquatic communities present in the ecosystem and some dyes are reported to cause allergic dermatitis, skin irritation, cancer and mutation in humans if they are discharged as wastewater without any treatment 8-12. There are no reports in this plant for adsorption studies. This prompted us to do research work in this adsorption of Congo red 4B dye using biomass from Thespesia Populnea seed. MATERIAL AND METHODS MATERIAL Thespesia Populnea seed (TPS) Ennore, Congo red 4B dye Cas.No: ASC 2562 Kevin laboratory (Avara synthesis Pvt.Ltd.), pH meter, UV-1800 Double Beam Spectrophotometer-(Shimadzu), transform spectrophotometer, SEM-Scanning electron microscopy (TEQIP Equipment), Orbital shaker, R- BC Laboratory centrifuge and Weighing machine and Air oven (Shimadzu). FTIR- Fourier (1) Where, m is the mass of adsorbent (g), v the volume of the solution (L), C0 is the initial concentration of dye (mg /L), Ce is the equilibrium dye concentration (mg/L) and qe is the amount of dye quantity adsorbed at equilibrium (mg/g). The percentage removal of dye from the solution was calculated by the following equation (2) METHODS Adsorbent Collection and Preparations (TPS): The Thespesia Populnea Seed (TPS) was collected from Ennore (India). Their seed was washed thoroughly with running tap water to removed sand, dirt and other impurities present in it and dried in sunlight for one week until all moisture were remove dried in an oven at 500C. It was the ground well in a mixer and sieved powdered. The TPS powder that passed through the sieve were stored in an air tight container labeled TPS and used as adsorbent without any further treatment. (2) Adsorption Isotherm Two adsorption isotherms models were applied to describe the sorption equilibrium in the present study such as Langmuir and Freundlich isotherm model. @ IJTSRD | Available Online @ www.ijtsrd.com | Volume – 2 | Issue – 1 | Nov-Dec 2017 Page: 321
International Journal of Trend in Scientific Research and Development (IJTSRD) ISSN: 2456-6470 Langmuir Isotherm The Langmuir sorption isotherm is applied to equilibrium sorption assuming monolayer sorption onto a surface with finite number if identical sites. The Langmuir equation is written as 13. Freundlich Isotherm The Freundlich isotherm is an empirical equation and is one of the most widely used isotherms for the description of multi site adsorption. The linear form as follows: Log qe = log KF + 1/n log Ce Where, KF and n are the Freundlich isotherm constants indication the adsorption capacity and adsorption intensity respectively 14. The KF and n can be calculated from the intercept and slop of the linear plot of log qe against log Ce. The significance of n is as follows; n=1(linear), n<1 (Chemical process), n>1 (Physical process). The Freundlich constant is heterogeneous factor and indicated that adsorption capacity the value of reflecting the more favorable adsorption. Adsorption capacity increase with increase in temperature Fig. 2(b) 1/qe=1/qmKLCe + 1/qm (3) (4) Where, qe is the amount of dye adsorbed at equilibrium (mg/g), q m is the amount of dye adsorbed when saturation is attained (mg/g), Ce is the equilibrium dye concentration (mg/L) and KL is the Langmuir constant related to the binding strength of the dye onto the adsorption. The Langmuir model described the monolayer adsorption. It assumes a uniform energy of adsorption, a single homogenous layer of adsorbed solute at a constant temperature Monolayer concentration increase with increase in temperature Fig. 2(a) 0.4 0.65 y = 2.1702x + 0.1005 R² = 0.9907 y = 0.6054x - 0.1012 R² = 0.9916 0.6 0.3 log qe 1/qe 0.2 0.55 0.1 0.5 0 1 1.1 1.2 1.3 0 0.05 1/Ce 0.1 log Ce (a) (b) Fig. 2 (a) Langmuir adsorption isotherm (b) Freundlich adsorption model TPS CR Table1. Characteristic parameter of the adsorption isotherm model for CR adsorbing by TPS Models Isotherms Constants Results Langmuir Freundlich qm (mg/g) KL (L/mg) R2 1/n N KF(mg/g) R2 10 0.046 0.990 0.605 1.652 -0.995 0.991 Adsorption Kinetics The Pseudo first order and Pseudo second order kinetic model were applied to study the adsorption kinetics of Congo red 4B dye to compete the extent of uptake in the adsorption processes. Pseudo first order kinetic model The linear form of the Lagergren’s Pseudo first order kinetic model is represented by the rate equation (5) (5) Where, qe and qt are the values of amount of the dye adsorbed per unit mass on the adsorbent at equilibrium and at various time t, respectively K1 and calculated qe can be from the slope and intercept respectively of the linear plot of log (qe-qt) versatile 15- 16 Fig. 3(a). These plots are linear; however linearity of these curves does not necessary assure first order @ IJTSRD | Available Online @ www.ijtsrd.com | Volume – 2 | Issue – 1 | Nov-Dec 2017 Page: 322
International Journal of Trend in Scientific Research and Development (IJTSRD) ISSN: 2456-6470 mechanism. Due mainly to the inherent disadvantages of correctly estimating equilibrium adsorption capacity the value obtained from the values; therefore first order kinetics is less likely to explain the rate processes. Pseudo second order kinetics The integrated form of the above model becomes, this model the rate determining step is biosorption mechanism involving biosorbate removal from solution is due to physio chemical interaction between biomass biosorbate solution 17. Intra particle diffusion model The intra particle diffusion model is expressed as, qt = Kidt1/2+C Where Kid is the amount of adsorbate time t (mg/g) and C is the variety of intercept (mg/g). A plot qt versus t1/2 gives a linear relationship from which kid values is determined from slope and value of C intercept gives an idea about thickness of boundary layer utilization of the most readily available adsorbing sites on the adsorbent surface. Table 2 chemisorptions, Where (7) (6) Where qt is the amount of the adsorbed at contact time t (mg/g), qe is amount of adsorbent adsorbed (mg/g) on the adsorbent at equilibrium. The initial adsorption rate h (mg.g-1min-1) is expressed as, among these models the criterion for their applicability is based on judgment the respectively correlation coefficient (R2) and agreement between experimental and calculated value of qe Fig. 3(b) In 15. This is attributed to the instantaneous 4.2 0 20 y = 0.2335x + 0.4032 R² = 0.9996 y = 0.0446x + 3.8169 R² = 0.8835 0 50 100 15 4.15 -0.5 log (qe-qt) y = -0.0139x - 0.314 R² = 0.8672 t/qt t/qt 10 4.1 5 -1 0 4.05 0 50 100 0 5 10 -1.5 t 1/2 Time Time a b c Fig. 3 (a) Pseudo first order (b) Pseudo second order (c) Intra particle diffusion kinetic models TPS CR Table2. Characteristic parameters of the adsorption kinetic model for CR adsorbing TPS Kinetic model Parameter Pseudo 1st order K1 (min-1) qe (mg/g) R2 Pseudo 2nd order h (mg.g-1 min-1) qe (mg/g) R2 Intra particle diffusion Kid C R2 Thermodynamic Parameter The Thermodynamics parameter such as change in Gibbs’s free energy change (∆G0), enthalpy (∆H0) and entropy (∆S0) were determined using the following equation. The Gibbs free energy ∆G equation expressed as following equation, ΔG° = -RT ln K (8) Results 0.029 0.686 0.867 2.481 4.291 0.999 0.053 3.579 0.937 Log K= ΔS°/ (2.303RT) - ΔH°/ (2.303RT) (9) Where K Equilibrium constant, R is universal gas constant (8.314 Jmol-1K-1) and T is temperature Kelvin, ∆S0 and ∆H0 are entropy and enthalpy respectively. The plot of ln K versus 1/T gives a linear respectively, which allows the computation of ∆S0 and ∆H0 values from the slope and intercept respectively. @ IJTSRD | Available Online @ www.ijtsrd.com | Volume – 2 | Issue – 1 | Nov-Dec 2017 Page: 323
International Journal of Trend in Scientific Research and Development (IJTSRD) ISSN: 2456-6470 ∆G0 values indicates thermodynamically spontaneous nature of the adsorption. The decrease in ∆G values with increasing temperature shows on increase in feasibility of adsorption at higher temperature. The value of ∆H 0 0.0029 0.003 0.00310.00320.00330.0034 For the negative was negative indicating that the nature of the adsorption is exothermic. The negative value of ∆S shows the decreasing randomness adsorbate solution interface during the adsorption process. -0.5 ln K -1 y = 633.23x - 2.8688 R² = 0.9931 -1.5 1/T Fig. 4 Thermodynamic parameter 1/T vs. ln K Table3. Thermodynamics parameter TPS CR ∆G (J.mol-1) ∆H(KJ.mol-1) ∆S(J.mol-1.K-1) R2 Temperature (K) 303 -1977 -12.123 -54.91 0.993 313 -2183 323 -2451 333 -2685 Alkenes, 1628.90 cm-1 C=O str from Ketones, 1440.89 cm-1 C-H def from Diaryl and Dialkyl Esters. 1369.98 cm-1 N-O str from Nitro compounds, -C-O str Alcohols, 1240.43 cm-1 C-O str from Esters and Lactones, 1150.26 cm-1 S=O str from Amine sulfides or Acids, 1017.46 cm-1 Salts of phosphate esters, 800.62 cm-1 N-H str from salts of Hydroxyl Halides , 690.39 cm-1 C-S str from Sulphonic acids , 567.95 cm-1 -NO2 Aryl nitro compounds. After adsorption of CR dye it was found that most of the functional groups the adsorbent were affected after the dye uptake process. This is judged from shifts in the position of some of the functional groups that moved at lower frequency or higher frequency or band intensity before and after CR adsorption includes 2913.50 cm-1 C-H str from Alkanes, 2853.56 cm-1 from C-H str from Alkyl groups, 1632.37 cm-1 NH3…SO3- from Amino sulfonic acids groups, 1525.40 cm-1 Aromatic compounds, 1015.12 cm-1 C- O str Carbohydrates, 554.01 cm-1 Ar-X aryl halides halogen groups respectively indicates involving of these groups for CR binding to TPS. SEM (Scanning Electron Microscopy) Fig. 6 shows that SEM image of TPS powder it can be observed from the external surface of TPS powder is RESULTS AND DISCUSSION Adsorbent characterization UV spectrum UV visible spectrum of adsorption bond 495nm was noticed that the spectrum changes of adsorption bond may confirm the strong bond between the active group present in the inhibitor molecule and solid surface. It can be used for detect the absorbance value for the CR dye in different stages. FTIR (Fourier Transform Infrared Spectroscopy) The FTIR spectrum of TPS before and after adsorption Fig. 5 of CR dye were analyzed to determine the vibration frequency changes in their functional groups for TPS before adsorption various peaks at 500-3500cm-1, Changes in the vibration and rotational movements of the molecule detection of functional groups which have specific vibration frequency. For example, C=O, NH2, -OH etc. Before adsorption of CR dye (3908.04cm-1 and 3809cm-1) from –OH hydroxyl groups,(3319.58 cm-1 and 3249.57 cm-1) N-H str from Amide groups, 3119.25 cm-1 from NH3+ Ammonium salts of carboxylic groups, 2915.41 cm-1 C-H str from Alkanes, 2849.09 cm-1 C-H str from Aryl and Aldehyde groups, 1736.95 cm-1 C=C str from @ IJTSRD | Available Online @ www.ijtsrd.com | Volume – 2 | Issue – 1 | Nov-Dec 2017 Page: 324
International Journal of Trend in Scientific Research and Development (IJTSRD) ISSN: 2456-6470 very irregular with heterogeneous ridges and pores. SEM micrographs of TPS before and after adsorption are pictured in Fig. 6 respectively. The prepared TPS presents a micro porous structure with different pore diameters. In addition the TPS surface seems to be rough and presents many protrusions before adsorption. This adsorption the TPS morphology has changed and the surface become smoother with less visible process, indication an adsorption on both the surface and within pores. Fig. 5 FTIR Fourier Transform Infrared Spectroscopy for before and after adsorption on TPS CR Fig. 6 SEM morphology image for TPS and TPS CR before and after adsorption increase in pH can be attributing for the adsorption sites on the adsorbent surface while the anionic groups of the CR dye for the adsorption sites on the adsorbent surface while at low pH values the negative charge (-OH) in the solution decrease and the adsorption surface is more positively charged thus enhancing attraction of the anion of the CR dye. Effect of adsorbent dosage The effect of adsorbent dosage as the percentage of CR dye as shown in Fig.7b it can be observed that the Influence of the Adsorption study Effect of pH The influence of pH on the adsorption of CR onto TPS is illustrated in Fig 7a it was observed that the percentage removal and adsorption capacity of CR by TPS decrease as pH increase from 3 to 8 optimum sorption was obtained at pH 3. The decrease in percentage removal and adsorption capacity with @ IJTSRD | Available Online @ www.ijtsrd.com | Volume – 2 | Issue – 1 | Nov-Dec 2017 Page: 325
International Journal of Trend in Scientific Research and Development (IJTSRD) ISSN: 2456-6470 percentage of CR dye increased with increase in the adsorbent dosage Although, adsorption capacity decreased with increase of adsorbent dosage. This is may be due to aggregation of the adsorption sites which limits the availability of all the active sites during adsorption process. Effect of Initial dye concentration The effect of initial dye CR concentration depicted in Fig. 7c It can be observed that the percentage removal of CR dye decrease with increase in initial concentration. This is due to the fact increase in dye concentration more dye molecules are available for adsorption by the adsorbent. This is attributes to the effects of concentration gradient which is the main deriving forces for the adsorption process. As the initial concentration increase, the available site on adsorbent surface area becomes less which causing increment in dye being adsorbed. However, these removal dyes percentage decrease. Which is been proved in Fig. 7c the experimental data showed of CR adsorbed decrease in particle size of the adsorbent. This indicated that the smaller TPS particles see for a given mass of TPS the more surface area is available and as a consequence the greater number of binding sites available. Effect of Contact time The effect of contact time on the removal of CR dye is depicted in Fig. 7d it can be observed that there was a rapid removal in the first 30 minute and it proceeds slowly until result has been reported for the adsorption of CR onto TPS powder. It can be inferred from the rapid sorption rate at the initial stage that there were great quantity of active site on the external surface of TPS which resulted in the swift CR dye removal. Once equilibrium is attained there was further increase since the remaining vacant sites are difficult to occupy probably due to the adsorbents and the bulk phase. Effect of Temperature The influence of temperature of the percentage removal of CR dye TPS is illustrated in Fig. 7e it can be observed the increase in temperature resulted in decreased in percentage removal of CR by TPS. This decrease in removal efficiency with increase in temperature can be attribute to the weakening of the physical bonding between the adsorbent CR dye and the active sites of the adsorbent (TPS). In addition the CR dye solubility also increases with increase in temperature resulting in the interaction between the solute and the solvents to be stronger than that between the solute was more different to adsorbed. the equilibrium 74 48 100 % removal % removal % removal 73 46 72 50 44 71 42 0 70 0 20 40 0 5 10 0 0.1 Dose (gm) 0.2 Con (mg/L) pH a b c 60 58 % removal 58 % removal 57 56 56 54 52 55 0 50 100 0 50 100 Time (K) Temperature (T) d e Fig. 7 Effects of (a) pH, (b) Adsorbent dosage, (c) Initial dye concentration, (d) Contact time, (e) Temperature TPS CR CONCLUSION Congo red 4B from industries wastewater using biomass (TPS) has been investigated under different experimental conditions. The adsorbing of CR dye was examined at different experimental conditions. The results corrugate that adsorption increase in increase contact time, temperature, adsorbent dosage Dyes are generally present in the effluents of textile industries. They are distribute in soils aquatic environment and are known to be a source of environment contaminates so the necessary demands to focus the attention on technique leading to complete removal of dye molecule. The removal of @ IJTSRD | Available Online @ www.ijtsrd.com | Volume – 2 | Issue – 1 | Nov-Dec 2017 Page: 326
International Journal of Trend in Scientific Research and Development (IJTSRD) ISSN: 2456-6470 and pH. The maximum removal of dye CR at 303K was found to be 57.73% for TPS, 75min-1 was found to be 57.79%, 22mg/L was found to be 47.72%, 0.12g was found to be 73.51% and pH was found to be 77.74% at maximum percentage removal in this study. Kinetic study shows the adsorption reaction follows Pseudo second (R2=0.999). The equilibrium data were found to be well represented by Freundlich isotherm shows that the surface is heterogeneous in nature. The percent research work established that TPS was excellent low- cost bio adsorbent for the removal of dye CR. The negative values of ∆G0 and the negative value of ∆H0 obtained indicated the spontaneous and exothermic nature of the adsorption process while the negative ∆S0 value obtained decreased randomness during the adsorption process. The kinetic and thermodynamic data can be Further explore for the design of an adsorbed for industrial effluents treatment. Degradation of Dyes under Visible Irradiation”, Langmuir, 24: 7338-7345. 9)Wang, S.; Zhu, Z. H., (2007), “Effects of acidic treatment of activated carbons on dye adsorption”, Dyes and Pigments, 75: 306-314. 10)Tahir, S. S.; Rauf, N., (2006), “Removal of cationic dye from aqueous solutions by adsorption onto bentonite clay”, Chemosphere, 63: 1842- 1848. order kinetic model 11)Gupta, V.K.; Mittal, A.; Kurup, L.; Mittal, J., (2006), “Adsorption of a hazardous dye, erthrosine, over hen feathers”, Journal of Colloid and Interface Science, 304: 52-57. 12)Chiou, M.; C., G., (2006) “Competitive adsorption of dye metanil yellow and RB15 in acid solutions on chemically cross-linked chitosan beads”, Chemosphere, 62: 731-740. 13)Langmuir, (1916) 1 Langmuir “The constitution and fundamental properties of soilds and liquid” J. Am.Chem.SOC., Volume 38,1916, PP 2221-2295 REFERENCES 1)Arulkumar.M., Sathishkumar.P., and Palvannan. V., (2011) “Optimization of Orange G dye adsorption by activated carbon of Thespesia populnea pods using methodology”, Journal of Hazardous Materials, Volume 186, Issue 1, 15 February, PP.827-834. 14)G.Limousin, J.P.Gaudet, L. Charlet, S.Szenknect, v.Barthes, M.Krimissa, “sorption isotherms: a review on physical bases, modeling and measurement”, Applied Geochemistry, 22,(2007), 249-275. respose surface 2)Vasudevan.M., “Pharmacological actions of Thespesia populnea relevant to Alzheimer’s dieases”, Phytomedicine, Volume 13, Issues 9-10, 24 November, pp.677- 687. Parle.M., (2006) 15)Theivarasu, C., and Myslamy, S. (2010), “Equilibrium and kinetic adsorption studies of Rhodamine B from aqueous solution using cocoa (Theobroma cacao) shell as new adsorbent”. International Journal of Engineering, Science and Technology, 2(1): 6284-6292. 3)Vijyakumar Dharmendirakumar M, J Mater Environ Sci.,( 2012), 3(1), 157-170. G, Tamilarasan R and 16)Dang, V. B. H., Doan, H.D., Dang-Vu, T., and Lohi, A. (2009), “Equilibrium and kinetics of biosorption of cadmium (II) and copper (II) ions by wheat straw”. 100:211-219. 4)Ho Y S and Mckay G, Can J Chem Eng., (1998) , 76(4), 822-827: DOI:10.1002/cjce.5450760419 Bioresource Technology 5)Walker G M, Hansen L, Hanna J A and Allen S J, Water Res., (2003), DOI:10.1016/S0043-1354(02)00540-7 17)Aksu, Z. and Yener, J. (2001), “A comparative adsorption/biosorption study of mono-chlorinated phenols onto various Management, 21: 695-702. 37(9), 2081-2089; sorbents’’. Waste 6)Stydini M, Dimitris I K and Verykios X E, Appl Catal B: Environ.. (2004), 47(3), 189-201; DOI:10.1016/j.apcatb.2003.09.014 7)Dogan M, Alkan M and Onganer Y, Water Air soil Pollut., (2000), DOI:10.1023/A:1005297724304 120(3-4), 229-248; 8)Wang, Q.; Chen, C.; Zhao, D.; Ma, W.; Zhao, J., (2008), “Change of Adsorption Modes of Dyes on Fluorinated TiO2 and its Effect of Photocatalytic @ IJTSRD | Available Online @ www.ijtsrd.com | Volume – 2 | Issue – 1 | Nov-Dec 2017 Page: 327