Download
1 / 6
60 likes | 91 Vues
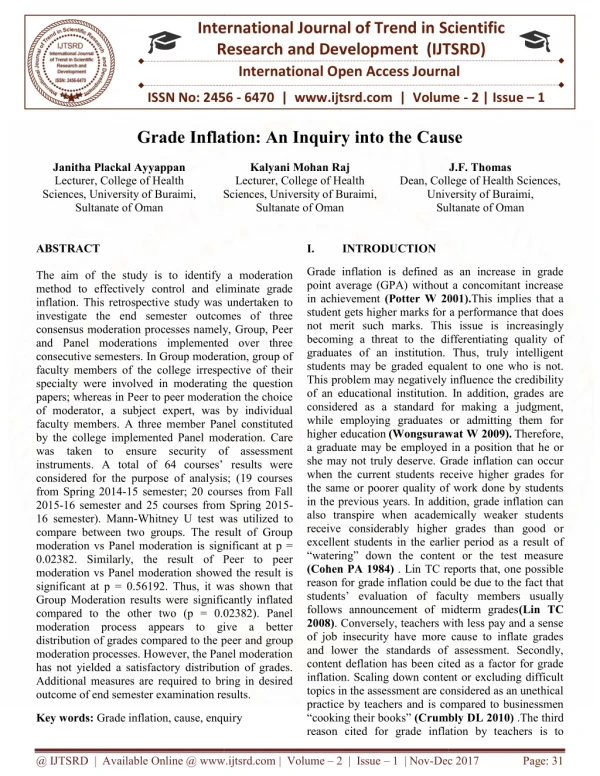
The aim of the study is to identify a moderation method to effectively control and eliminate grade inflation. This retrospective study was undertaken to investigate the end semester outcomes of three consensus moderation processes namely, Group, Peer and Panel moderations implemented over three consecutive semesters. In Group moderation, group of faculty members of the college irrespective of their specialty were involved in moderating the question papers whereas in Peer to peer moderation the choice of moderator, a subject expert, was by individual faculty members. A three member Panel constituted by the college implemented Panel moderation. Care was taken to ensure security of assessment instruments. A total of 64 courses' results were considered for the purpose of analysis 19 courses from Spring 2014 15 semester 20 courses from Fall 2015 16 semester and 25 courses from Spring 2015 16 semester . Mann Whitney U test was utilized to compare between two groups. The result of Group moderation vs Panel moderation is significant at p = 0.02382. Similarly, the result of Peer to peer moderation vs Panel moderation showed the result is significant at p = 0.56192. Thus, it was shown that Group Moderation results were significantly inflated compared to the other two p = 0.02382 . Panel moderation process appears to give a better distribution of grades compared to the peer and group moderation processes. However, the Panel moderation has not yielded a satisfactory distribution of grades. Additional measures are required to bring in desired outcome of end semester examination results. Janitha Plackal Ayyappan | Kalyani Mohan Raj | J.F. Thomas "Grade Inflation: An Inquiry into the Cause" Published in International Journal of Trend in Scientific Research and Development (ijtsrd), ISSN: 2456-6470, Volume-2 | Issue-1 , December 2017, URL: https://www.ijtsrd.com/papers/ijtsrd5844.pdf Paper URL: http://www.ijtsrd.com/medicine/nursing/5844/grade-inflation-an-inquiry-into-the-cause/janitha-plackal-ayyappan<br>

E N D
International Research Research and Development (IJTSRD) International Open Access Journal Grade Inflation: An Inquiry into the Cause International Journal of Trend in Scientific Scientific (IJTSRD) International Open Access Journal ISSN No: 2456 ISSN No: 2456 - 6470 | www.ijtsrd.com | Volume | www.ijtsrd.com | Volume - 2 | Issue – 1 Grade Inflation: An Inquiry into the Janitha Plackal Ayyappan Lecturer, College of Health Sciences, University of Buraimi, Sultanate of Oman Cause Kalyani Mohan Raj Lecturer, College of Health J.F. Thomas Dean, College of Health Sciences, University of Buraimi, Dean, College of Health Sciences, University o Sultanate of Oman Sultanate of Oman Sciences, University o Sciences, University of Buraimi, Sultanate of Oman I. ABSTRACT The aim of the study is to identify a moderation method to effectively control and eliminate grade inflation. This retrospective study was undertaken to investigate the end semester outcomes of three consensus moderation processes namely, Group, Peer and Panel moderations implemented over three consecutive semesters. In Group moderation, group of faculty members of the college irrespective of their specialty were involved in moderating the question papers; whereas in Peer to peer moderation the choice of moderator, a subject expert, was by individual faculty members. A three member Panel constituted by the college implemented Panel moderation. Care was taken to ensure security of assessment instruments. A total of 64 courses’ results were considered for the purpose of analysis; (19 courses from Spring 2014-15 semester; 20 courses from Fall 2015-16 semester and 25 courses from Spring 2015 16 semester). Mann-Whitney U test was utilized to compare between two groups. The result of Group moderation vs Panel moderation is significant at p = 0.02382. Similarly, the result of Peer to peer moderation vs Panel moderation showed the result is significant at p = 0.56192. Thus, it was shown that Group Moderation results were significantly inflated compared to the other two (p = 0.02382). Panel moderation process appears to give a better distribution of grades compared to the peer moderation processes. However, the Panel moderation has not yielded a satisfactory distribution of grades. Additional measures are required to bring in desired outcome of end semester examination results. outcome of end semester examination results. INTRODUCTION Grade inflation is defined as an increase in grade point average (GPA) without a concomitant increase (Potter W 2001).This implies that a student gets higher marks for a performance that does not merit such marks. This issue is increasingly becoming a threat to the differentiating quality of graduates of an institution. Thus, truly intelligent students may be graded equalent to one who is not. This problem may negatively influence the credibility Grade inflation is defined as an increase in grade point average (GPA) without a concomitant increase in achievement (Potter W 2001). student gets higher marks for a performance that does not merit such marks. This issue becoming a threat to the differentiating quality of graduates of an institution. Thus, truly intelligent students may be graded equalent to one who is not. This problem may negatively influence the credibility of an educational institution. considered as a standard for making a judgment, while employing graduates or admitting them for higher education(Wongsurawat W 2009). a graduate may be employed in a position that he or she may not truly deserve. Grade when the current students receive higher grades for the same or poorer quality of work done by students in the previous years. In addition, grade inflation can also transpire when academically weaker students receive considerably higher excellent students in the earlier period as a result of “watering” down the content or the test measure (Cohen PA 1984) . Lin TC reports that, one possible reason for grade inflation could be due to the fact that students’ evaluation of faculty members usually follows announcement of midterm grades 2008). Conversely, teachers with less pay and a sense of job insecurity have more cause to inflate grades and lower the standards of assessment. Secondly, content deflation has been cited as a factor for grade inflation. Scaling down content or excluding difficult topics in the assessment are considered as an unethical practice by teachers and is compared to businessmen “cooking their books” (Crumbly DL 2010) reason cited for grade inflation by teachers is to grade inflation by teachers is to The aim of the study is to identify a moderation method to effectively control and eliminate grade This retrospective study was undertaken to investigate the end semester outcomes of three consensus moderation processes namely, Group, Peer and Panel moderations implemented over three consecutive semesters. In Group moderation, group of f the college irrespective of their specialty were involved in moderating the question papers; whereas in Peer to peer moderation the choice of moderator, a subject expert, was by individual faculty members. A three member Panel constituted implemented Panel moderation. Care was taken to ensure security of assessment instruments. A total of 64 courses’ results were considered for the purpose of analysis; (19 courses 15 semester; 20 courses from Fall In addition, grades are considered as a standard for making a judgment, while employing graduates or admitting them for (Wongsurawat W 2009).Therefore, a graduate may be employed in a position that he or she may not truly deserve. Grade inflation can occur when the current students receive higher grades for the same or poorer quality of work done by students in the previous years. In addition, grade inflation can also transpire when academically weaker students urses from Spring 2015- Whitney U test was utilized to grades than good or compare between two groups. The result of Group moderation vs Panel moderation is significant at p = 0.02382. Similarly, the result of Peer to peer excellent students in the earlier period as a result of “watering” down the content or the test measure . Lin TC reports that, one possible reason for grade inflation could be due to the fact that f faculty members usually follows announcement of midterm grades(Lin TC . Conversely, teachers with less pay and a sense of job insecurity have more cause to inflate grades and lower the standards of assessment. Secondly, ed the result is significant at p = 0.56192. Thus, it was shown that Group Moderation results were significantly inflated compared to the other two (p = 0.02382). Panel moderation process appears to give a better distribution of grades compared to the peer and group moderation processes. However, the Panel moderation has not yielded a satisfactory distribution of grades. Additional measures are required to bring in desired ted as a factor for grade inflation. Scaling down content or excluding difficult topics in the assessment are considered as an unethical practice by teachers and is compared to businessmen (Crumbly DL 2010) .The third Key words: Grade inflation, cause, enqui Grade inflation, cause, enquiry @ IJTSRD | Available Online @ www.ijtsrd.com @ IJTSRD | Available Online @ www.ijtsrd.com | Volume – 2 | Issue – 1 | Nov-Dec Dec 2017 Page: 31
International Journal of Trend in Scientific Research and Development (IJTSRD) ISSN: 2456-6470 prevent students withdrawing from their courses (Gohmann SF 2001). Nevertheless, grade inflation does not solely rest upon the teacher-student relationship but several institutional factors also contribute to this such as workload, and course difficulty (Marsh HW 2000). In addition, students pestering for higher marks are a compelling reason for grade inflation (Franz WJ 2010) Furthermore, pressure on teachers to undertake research and publish is identified as one of the contributing factors for grade inflation (Nagel B 1998). Finally, since lack of objectivity in evaluation is one of the leading causes of grade inflation (Johnson VE 2006). Context and Interventions of the Study: This exercise was undertaken as a pilot project by the college concerned as a part of good academic practice to ensure that question paper will align with course specifications and quality validation process. As a part of this; in spring 2014-15 group moderation was carried out followed by peer Moderation in Fall 2015- 16 and finally Panel moderation was conducted during spring 2015-16. The criteria for selecting courses for this study were; courses that consistently showed grade inflation across semesters. Courses of 6 faculty members meeting the criteria were chosen. Thus, the results of their courses render themselves for comparison. For the purpose Of this study grade inflation was considered when the number of “A”s and “B” exceeds 15.5 to 16% of total grades. This limit is based on a report that correlation between IQ and elementary school grades is 0.65 (Seligman D.A 1992). Since this is a highly positive correlation, it could be safely assumed that grade is likely to be distributed similarly to IQ. As IQ is distributed normally it follows that grades also are to be distributed normally. Using this assumption to standardize grade distribution, C and C+ should fall within one standard deviation of the average grade (68%). Likewise, D, D+ and B, B+ should be in the second standard deviation from average (13.5% each). Similarly, F and A falls within the third standard deviation from the average (2% each). Hence, 13.5% of “B”s and 2% of “A”s should constitute 15.5% of the total grade. In addition, ensure security of assessments a single soft copy of the proposed question Paper was projected and moderators were requested to critique the presented paper. The Course Instructor presenting the paper was given the freedom to either accept or reject the suggestions. The result of the process did not achieve expected outcomes. Other methods were subsequently introduced to achieve desired goals. This study was undertaken to investigate the root cause of this inflation and to identify the efficacy of question paper moderation process. The Objective of the Study was the following. 1. To compare the pattern of grade distribution among the moderation methods. II. METHODOLOGY: A retrospective comparative study was conducted to compare the outcome of three different processes of question paper moderation (Peer, Group, and Panel), in the University of Buraimi, Sultanate of Oman. The analysis period spans three consecutive semesters from spring 2014-15 to spring 2015-16. The method included analysis of a set of results from three consecutive semesters and to identify a pattern of grade distribution with the method of moderation. Sample Size: The sample size consisted of the results of 64 courses’ were selected for the purpose of analysis; (19 courses from Spring 2014-15 semester; 20 courses from Fall 2015-16 semester and 25 courses from Spring 2015-16 semester).In Spring 2014-15 group moderation was carried out followed by peer Moderation in Fall 2015-16 and finally panel moderation was conducted during Spring 2015-16. Ethical Considerations: The investigators obtained the permission from the research and ethics committee, and from the Dean of College of health sciences. The purpose of analyzing the examination grades was explained to the selected course coordinators and oral consent obtained. The concerned faculty were assured that the individual’s identity will not be revealed to any unauthorized person will not be reflected in the performance evaluation. Constitution of Groups for Moderation: Faculty members of the college irrespective of their specialty were present to moderate the question paper. The size of the group was determined by the availability of faculty members at the time of the moderation process and varied from course to course. However, at least one subject expert was present in the group to ensure content validity. @ IJTSRD | Available Online @ www.ijtsrd.com | Volume – 2 | Issue – 1 | Nov-Dec 2017 Page: 32
International Journal of Trend in Scientific Research and Development (IJTSRD) ISSN: 2456-6470 depicts the results of Peer Moderated paper results of Fall 2015-16. It is observed that 27.3% of A’ grades are conferred in place of the claimed 2%. Likewise, B grade (38.35) is almost three times the proposed number (13.5%). Contrarily C grade is found to be 17%, which is four times less than the suggested (68%) and F grade is only 0.8%, 1.2% less than the expected (2%). Nevertheless, D grade 15.6% is closer to the recommended 13.5%. A grades given are 9.4% that is 4 times higher, and F grade is 4.3%, which is two times more than the required2%, while B (27.9%) and D (24.8%) are double the proposed number of 13.5%. On the other hand, C grade (33%) reflects 50% less than the expected of 68%. Mann – Whitney U test was applied to compare two groups Vis a Vis Group moderation vs Panel moderation and Peer moderation vs Panel moderation. The result of Group moderation vs Panel moderation is significant at p = 0.02382. However, the result of Peer moderation vs Panel moderation shows the result is significant at p = 0.56192. Thus, it was shown that Group Moderation results were significantly inflated compared to the other two (p = 0.02382). Selecting a Peer for moderation: Peer was the choice of each individual faculty member, a subjectexpert. Peer should have served in the university for more than one academic year. Constitution of a Panel: The panel was led by a Ph.D. with two subject experts to assist. Themembers had a consistent previous record of good assessment design and grade distribution. Two panels one for each discipline were constituted. The process of Panel Moderation: The subject experts in the panel reviewed the question paperscritically cross-matching with the monthly course completion report in order to ensure adequate coverage of content in the question paper. The comments were recorded in the specified moderation document containing moderation guidelines, and ensured compliance in the final version of question paper before printing. III. DATA ANALYSIS: While the distribution of grades from Fall semester question papers moderated by peers, which is skewed to the left implying that A’s and B’s are more than the lower grades. Depicts the distribution of results obtained in spring semester question papers moderated by a panel in Fall 2015-16. The shape of the distribution is close to normal distribution curve. However, D grade is more than the D+ grade that detracts it from a normal distribution curve. Data entered and analyzed by using SPSS 16.0 version statistical software Package. End semester results of three consecutive semesterswere taken into consideration for analysis. distribution, Mann – Whitney U test and Categorical variable – grades; A grade above 90%, B 80 -90% , C 70 – 80%, D 60-70% and F < 60% was considered to interpret the data. Grades rather than the marks were analyzed since Oman Higher education qualification framework includes grades and not mark. The percentage Discussion: Moderation process has been cited as an important tool for ensuring quality in higher education systems (Smith AC 2012). In our college, as a part of good academic practice, moderation process is used as an instrument to ensure that fair and accurate measure of students’ performance is reflected by the grades they score. However, analysis of the grades in our study shows that there is a consistent inflation of “A and B” grades in certain courses. Distribution of courses across the semesters: A total of 64 (%) courses were taken over the three semesters; out of that 19 (12%) course were selected from spring 14-15, 20 (13%) courses were chosen from fall 15-16 and 25 (16%) Courses were taken from spring 15-16. The distribution of grades obtained in spring 2014-15 semester question papers were moderated by the Group. And the distribution resembles a normal curve from A grade to D+ grade. The number of A grade awarded is almost five times (11.5%) and F grade four times (8.1%) more than the recommended (2%). Similarly, grades B (32.3%) and D (26.6%) are also found to be nearly double the expected number (13.5%). On the other hand, C grade, which is expected to be the (68%), is found to be 26.6% just one-third of the expected number. In an effort to curb the inflation of grades various measures were undertaken one of them being a different process of moderation. A fivefold increase in ‘A’ grades i.e. 11.5% instead of the expected 2% in results of question papers moderated by group method was observed. This inflation has occurred probably due to lack of more than one subject expert present @ IJTSRD | Available Online @ www.ijtsrd.com | Volume – 2 | Issue – 1 | Nov-Dec 2017 Page: 33
International Journal of Trend in Scientific Research and Development (IJTSRD) ISSN: 2456-6470 during the group moderation process since the constitution of group members depended on the availability of faculty members at the time of moderation rather than any specified criteria. process; not including course assessment and midterm examination, which have a considerable bearing on the final examination grades.Moreover, moderation process did not include the recently introduced ‘Table of Specification’ for the question paper or evidence of content coverage adequately to ensure the validity of the question paper. Due to the increasing number of faculty members and the number of courses offered, peer moderation instead of group moderation was proposed and carried out in Fall 215-16. However, it is apparent that ‘A’ grades have spiked to an unacceptable 27.3% in results of peer-moderated papers. The peers for moderating question papers were selected by individual faculty members according to their convenience, which could have resulted in very superficial moderation exercise failing to control grade inflation. Table 1: Distribution of courses over semesters Number of courses 19 20 25 64 Semester Spring 2014-15 Fall 2015-16 Spring 2015-16 Total It is expected that a maximum number of students will obtain C, which is considered the average grade. And thus, not only an increase in A grade but an equally undesirable decrease in C grade i.e. 26.6% in group moderated results and 18% in peer moderated as against the standard 68%were observed. Since both group and peer moderation methods have failed to bring about a desirable change in grade distribution, in Spring 2015-16 a panel was constituted to moderate the Table 2: Percentage of grade distribution across three consecutive semesters Group A B+ B C+ C D+ D F Peer % Observed 11.5 15 17.3 14.8 11.8 6.5 15 8.1 % OBSERVED % OBSERVED %Recommended 2 6.75 6.75 34 34 6.75 6.75 2 % RECEOMMENDED 2 6.75 6.75 34 34 6.75 6.75 2 % RECEOMMENDED 2 6.75 6.75 34 34 6.75 6.75 2 Question papers. The results of this exercise have brought in a significant change in grade distribution as observed from Table 3 which shows that A grade is 9.4% as against 11.5% of the group and 27.3% of peer moderation. Likewise, C grade has increased to 33.7% compared to 26.6% of the group and 18% of peer moderation results. A B+ B C+ C D+ D F Panel Conclusion: Among the three moderation methods, panel moderation seems to have achieved better grade control compared to group and peer. Even though, panel moderation results reflect the near normal distribution curve it has not met expected criteria for grade distribution. A B+ B C+ C D+ D F Limitations of the study: In this study, only a limited number of courses were analyzed not including entire courses offered in the programme. Only the end semester examination question paper was subjected to the moderation @ IJTSRD | Available Online @ www.ijtsrd.com | Volume – 2 | Issue – 1 | Nov-Dec 2017 Page: 34
International Journal of Trend in Scientific Research and Development (IJTSRD) ISSN: 2456-6470 F R E Q U E N C y Grade distribution -Group Moderation-Spring 2014-15 140 120 104 104 103 100 A 82 80 B+ 80 B 56 C+ 45 C 40 D+ D 0 GRADES Figure: 1 Graph showing grade distribution of results from papers moderated by the group in Spring 2014-15 Grade distribution - Peer Moderation-Fall 2015-16 180 A 160 B+ 88 140 B 68 54 53 120 C+ 25 C 5 100 D+ Grades Figure: 2 Graph showing grade distribution of results from papers moderated by peers in Fall 2015-16 Figure: 3 Graph showing grade distribution of results from papers moderated by a panel in Spring 2015-16 @ IJTSRD | Available Online @ www.ijtsrd.com | Volume – 2 | Issue – 1 | Nov-Dec 2017 Page: 35
International Journal of Trend in Scientific Research and Development (IJTSRD) ISSN: 2456-6470 Table-3: Mann-Whitney U Test Groups U Value Z Score P value Group vs Panel – Spring 2014-15 vs Spring 2015-16 Peer vs Panel –Fall 2015-16 vs Spring 2015-16 10 2.25 0.02 26 0.5 0.56 Group vs Peer – Spring 2014-15 vs Fall 2015-16 24 0.7 0.42 Acknowledgements: coursework deflation?. Journal of Academic Ethics, 8(3), 187-197. The teachers who had shared their information necessary to write this paper. The Dean of our Institute for his constant guidance, support, and encouragement. The authors are thankful to all the faculty members of College of health Sciences for their permission to use the examination results for analysis. Further, a heartfelt gratitude is extended to Dr. Krupa Philip and Mr. Babu Noushad (Faculty- College of Health Sciences) for their expert advice and guidance. 6)Gohmann, S. F., & McCrickard, M. J. (2001). Tenure status and grade inflation: A time series approach. Journal of the Academy of Business Education, 2, 1-8. 7)Marsh, H. W., & Roche, L. A. (2000). Effects of grading leniency and low workload on students' evaluations of teaching: Popular myth, bias, validity, or innocent bystanders?. Journal of Educational Psychology, 92(1), 202 REFERENCES 1)Potter, W., Nyman, M. A., & Klumpp, K. S. (2001). Be careful what you wish for: Analysis of grading trends at a small liberal arts college, grade inflation or progress?. College University, 76(4), 9. 8)Franz, W. J. I. (2010). Grade inflation under the threat of students’ nuisance: Theory and evidence. Economics of Education Review, 29(3), 411-422 and 9)Nagle, B. (1998). A proposal for dealing with grade inflation: The index. Journal of Education for Business, 74(1), 40-43. 2)Wongsurawat, W. (2009). Does grade inflation affect the credibility of grades? Evidence from US law school Economics, 17(4), 523-534. relative performance admissions. Education 10)Johnson, V. E. (2006). Beyond Grade Inflation: Grading Problems in Higher Education. The Review of Higher Education, 30(1), 76-77 3)Cohen, P. A. (1984). College grades and adult achievement: A research synthesis. Research in Higher Education, 20(3), 281-293. 11)Seligman, D. (1992). A question of intelligence: The IQ debate in America 4)Lin, T. C. (2008). Economic behavior in student ratings of teaching: revenge or reward?. 12)Smith, C. (2012). Why should we bother with assessment moderation?. Nurse today, 32(6), 5)Crumbley, D. L., Flinn, R. E., & Reichelt, K. J. (2010). What is ethical about grade inflation and education e45-e48 @ IJTSRD | Available Online @ www.ijtsrd.com | Volume – 2 | Issue – 1 | Nov-Dec 2017 Page: 36