Download
1 / 11
110 likes | 159 Vues
The prime objective of this study is to design, analyze and optimize the silica fume blended concrete using Statistical Mixture Experiment and to explore the practicability of Statistical mixture experiment in mix design of concrete containing the several components. The traditional mix design methods have drawbacks. Traditional method of mix design of concrete fails in designing the complex concrete mixture containing the cementitious materials, pozzolanic materials and several admixtures. Traditional methods are based on trial and error method in which effect of only one component can be determined. Trial and error does not provide the whole picture of concrete mixture. In this study, the statistical mixture design method is employed to analyze the effects of silica fume on 28 days compressive strength of concrete and to design and optimize the silica fume blended concrete. The components of concrete mixture are Cement, silica fume, water and aggregate. Total of 15 runs or design points are generated which are combinations of proportions and laboratory experiment is carried out on these design points and 28 days compressive strength is measured. Mathematical relationship is established between 28 days compressive strength and proportions of components using least square technique and then mathematical model is studied to analyze the effects of silica fume in concrete. Pankaj Kumar | M. C Paliwal "Study of Silica Fume Blended Concrete using Statistical Mixture Experiment and Optimizing of Compressive Strength of Cement Concrete" Published in International Journal of Trend in Scientific Research and Development (ijtsrd), ISSN: 2456-6470, Volume-3 | Issue-4 , June 2019, URL: https://www.ijtsrd.com/papers/ijtsrd25178.pdf Paper URL: https://www.ijtsrd.com/engineering/civil-engineering/25178/study-of-silica-fume-blended-concrete-using-statistical-mixture-experiment-and-optimizing-of-compressive-strength-of-cement-concrete/pankaj-kumar<br>

E N D
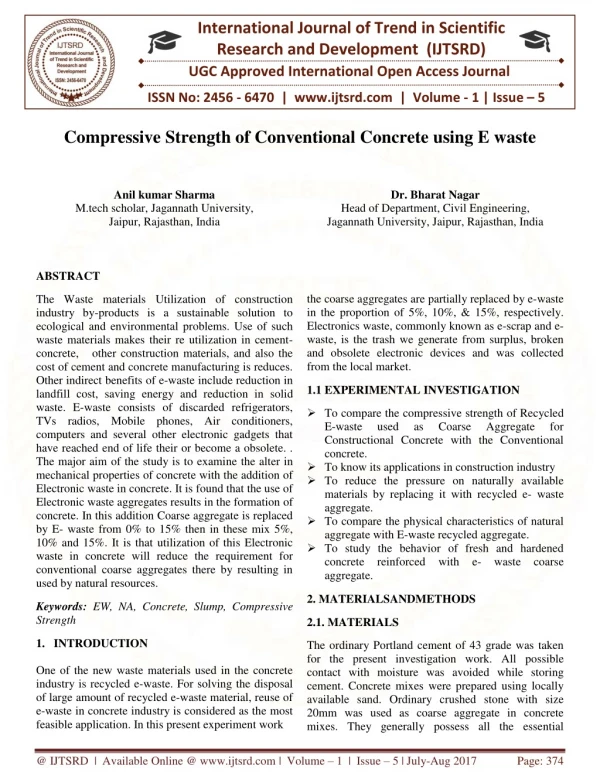
International Journal of Trend in Scientific Research and Development (IJTSRD) Volume: 3 | Issue: 4 | May-Jun 2019 Available Online: www.ijtsrd.com e-ISSN: 2456 - 6470 Study of Silica Fume Blended Concrete using Statistical Mixture Experiment and Optimizing of Compressive Strength of Cement Concrete Pankaj Kumar1, M. C Paliwal2 1M.Tech Scholar, 2Associate Professor, Department of Civil & Environmental Engineering 1,2National Institute of Technical Teachers Training (NITTTR), Bhopal, Madhya Pradesh, India How to cite this paper: Pankaj Kumar | M. C Paliwal "Study of Silica Fume Blended Concrete using Statistical Mixture Experiment and Optimizing of Compressive Strength of Cement Concrete" Published in International Journal of Trend in Scientific Research and Development (ijtsrd), ISSN: 2456- 6470, Volume-3 | Issue-4, June 2019, pp.1489-1499, URL: https://www.ijtsrd.c om/papers/ijtsrd25 178.pdf Copyright © 2019 by author(s) and International Journal of Trend in Scientific Research and Development Journal. This is an Open Access article distributed under the terms of the Creative Commons Attribution License (CC BY 4.0) (http://creativecommons.org/licenses/ by/4.0) 1.INTRODUCTION Concrete is a mixture of many components such as cement, water, aggregates, and supplementary cementitious materials such as silica fume etc. For given set of materials, the proportions of components directly manipulate the properties of concrete mixture, both fresh and hardened. It is essential to optimize this complex mixture to meet the certain performance criteria such as compressive strength, workability etc. Combined with numerous performance criteria, the number of trial batches required to find optimal proportions using traditional methods could become prohibitive. The common approach to concrete mixture proportioning can be described by the following steps: 1.Identifying a preliminary set of mixture proportions. 2.Performing many trial batches, first with the mixture identified in step 1 above, and adjusting the proportions in following trial batches until all criteria are fulfilled. 1.1Experimental Investigation ?To use statistical mixture experiment as a systematic approach in design and optimization of mix design of silica fume blended concrete. ABSTRACT The prime objective of this study is to design, analyze and optimize the silica fume blended concrete using Statistical Mixture Experiment and to explore the practicability of Statistical mixture experiment in mix design of concrete containing the several components. The traditional mix design methods have drawbacks. Traditional method of mix design of concrete fails in designing the complex concrete mixture containing the cementitious materials, pozzolanic materials and several admixtures. Traditional methods are based on trial and error method in which effect of only one component can be determined. Trial and error does not provide the whole picture of concrete mixture. In this study, the statistical mixture design method is employed to analyze the effects of silica fume on 28 days compressive strength of concrete and to design and optimize the silica fume blended concrete. The components of concrete mixture are Cement, silica fume, water and aggregate. Total of 15 runs or design points are generated which are combinations of proportions and laboratory experiment is carried out on these design points and 28 days compressive strength is measured. Mathematical relationship is established between 28 days compressive strength and proportions of components using least square technique and then mathematical model is studied to analyze the effects of silica fume in concrete. Keywords: Silica fume, Compressive strength, Slump Value, Total sum of square, Model sum of square IJTSRD25178 ?To statistically investigate the effects of silica fume in concrete using statistical mixture experiment. 2.BACKGROUND EXPRIMENT 2.1 Mixture Experiments The experiments which involve blending of several parts are known as mixture experiments. In these experiments the quality or response of the end product depends upon relative proportion of the parts in a mixture. In mixture experiments, the treatments are either: 1.A grouping of two or more components whose sum is a fixed amount implying that their levels are not self- determining (Montgomery 2005) 2.Quantity of inputs functional at various experimental steps such that sum total of the quantities functional at different experimental steps is fixed. 2.2 Statistical Mixture Experiment Statistical mixture experiment is used to conduct experiments on mixture of two or more components. In mixture experiment, the input variables or factors are ON STATISTICAL MIXTURE @ IJTSRD | Unique Paper ID – IJTSRD25178 | Volume – 3 | Issue – 4 | May-Jun 2019 Page: 1489
International Journal of Trend in Scientific Research and Development (IJTSRD) @ www.ijtsrd.com eISSN: 2456-6470 3)Experiment on design points. 4)Mathematical Model fitting. 5)Mathematical Model validation. 6)Prediction and Optimization of response variables according to performance criteria. 3.1 Selection of Design Points There are various methods available to determine design points i.e. the points or proportions on which experiment is carried out. The methods are simplex lattice design, and d- optimal design. In this study using d-optimal design for selection of design point. 3.1.2 D-Optimal Design In d-optimal design, first mathematical model is chosen and design points are generated by computer algorithm. Let the response of mixture is related to its proportions of components by equation (3.1). Where, is vector of observation, is vector of proportions, is vector of least square estimator and is the vector of errors. These vectors are given by proportion of components of mixture and the sum of the proportion of components is unity i.e. the quantity of mixture is constant. The proportions of components are not independent i.e. if there is n number of components in mixture; only n−1 can be set independently. Responses of mixture are various Properties resulting from blending of components of mixture and depend upon the proportion of components. Let us consider a mixture in which there are n components. If X1, X2,….,Xn are the proportions of n components respectively, then relation between proportions is given by (2.1) (2.2) Equation (2.1) and (2.2) describe the constraints on proportions. Thus components vary between 0 and 1 and remaining component is dependent on settings of components. (Murty & Das, 1968). In the case of concrete mixture, components are cement, pozzolanic materials, water, coarse aggregate and fine aggregate and response or output variables are compressive strength, tensile strength, flexural strength, workability etc. 2.3 Experimental Design Detail In the statistical mixture methodology, the measured responses are assumed to depend on the proportion of materials present in the mixture rather than on the amount of mixture. In general, in a mixture with n-components where xi represents the proportion of the the mixture, the relation between variables is as in equation [2.3] Scheffe’s linear model is (3.1) , , , component in is the number of observations and is the number of components in mixture. The least square estimator is given by And variance of is given by (3.2) (2.3) Where, = response of mixture = number of components of mixture = proportion of = a coefficient of regression. (Cornell, 1981) For example, the linear model for the mixture of three components is (3.3) Where, is error variance. The variance of is directly component proportional to minimum for best fit. In d-optimal design, the vector of mixture proportions are so chosen that minimum. (Montgomery, et al., 2002) 3.2 Selection of Mathematical Model Appropriate mathematical model is chosen after selection of design points. There is close relation between selection of design points and model selection i.e. the selection of model is depend upon number of design points of experiment. The polynomial model is recommended however other models can also be chosen. The special Scheffe’s canonical polynomial equations are used for modelling of mixture system which are as follows: and variance of should be becomes (2.4) The mathematical relationship is established between proportions i.e. input variables and output variables. In concrete mixture the input variables are proportions of cement, water, pozzolanic materials, coarse aggregate and fine aggregate and the output variable or response is compressive strength and slump value. The mathematical relationship between proportions of component and response or output variables is called as mathematical model of mixture. 3.METHODOLOGY The whole procedure of statistical mixture experiment is as follows: 1)Selection of design points. 2)Selection of mathematical model. Where, components of mixture, component and is the response of mixture, is the number of is the proportion of is the coefficient of regression. @ IJTSRD | Unique Paper ID – IJTSRD25178 | Volume – 3 | Issue – 4 | May-Jun 2019 Page: 1490
International Journal of Trend in Scientific Research and Development (IJTSRD) @ www.ijtsrd.com eISSN: 2456-6470 For example, the linear model for the mixture of three components is Eight days compressive strength of Portland cement is measured As per IS: 4031 (Part 6)-1988. The initial and final setting time is measured according to IS: 4031 (Part 5)-1988. Table4.1: Properties of cement. S. No Properties 1. Initial setting time (min) 2. Final setting time (min) 3. 28 days Compressive strength (MPa) 4. Specific gravity 4.2.2 Silica Fume Silica fume is supplied by Normet India Private limited, U.S Nagar Uttrakhand. The specific gravity of silica fume is taken 2.2. (Holland, 2005) 2.2.3 Course Aggregate The coarse aggregate is obtained from locally available resources conforming to IS: 383-1970. The maximum size of 20 mm is selected for this study. The properties of coarse aggregate, which are measured, are as follows: Table4.2: Properties of Course Aggregate S. No Properties 1. Specific gravity 2. Water absorption 3. Aggregate impact value 4. Aggregate crushing value 4.2.4 Fine Aggregate Specific gravity and water absorption of fine aggregate are determined in this study. Table 4.3: Properties of Fine Aggregate S. No Properties 1. Specific gravity 2. Water absorption 0.80% 4.2.5 Water Water conforming to IS code is used in this research 4.3 Selection of Responses Responses are properties of mixture. In this research, following responses are selected for study: 1.28 days Compressive strength of mixture. 2.Slump value of mixture. 4.4 Selection of Appropriate Ranges of Components of Mixture In statistical mixture experiment, the sum of proportions of components is unity. The selection of maximum and minimum level of proportion of components is depending upon engineering knowledge about mixture. The maximum and minimum level of proportion of each component is selected according to previous researches and conforming to IS: 10262-2009 and IS: 456-2000. These minimum and maximum levels are called as constraints. In addition to these constraints, linear constraints are also applied in this design to keep the water to cementitious ratio 0.4 to 0.5. the % level of replacement of silica fume are keep 5 to 25 %.The maximum and minimum level of proportion of components by volume is shown in Table 4.4, the minimum and maximum level of proportion of components by weight is shown in Table 4.5. Scheffe’s Quadratic model can be represented as Value 92 408 57 3.15 where, components of mixture, is the response of mixture, is the number of are the proportions of component, is a coefficient of linear portion of is the coefficient of quadratic portion of equation and equation. (Cornell, 1981) For example, the quadratic model for the mixture of three components is (3.6) 3.3.Experiments on Design Points The experiment is carried out on generated design points of mixture and response variables or properties of mixture are calculated for all design points. The design point is generated by design expert software based on d-optimal design. 3.4.Mathematical Model Fitting The selected Model is fitted to data obtained in experiment using principle of least squares and Analysis of variance (ANOVA) and mathematical relationship is established between input variables i.e. proportions of components of mixture and responses of mixture. (Simon, et al., 1997) 3.5.Mathematical Model Validation The polynomial models explain in sections 3.2.3 is fit to data using analysis of variance (ANOVA) and least squares techniques. Many statistical software packages have the ability to perform these analyses and fits. Once a model has been fit, it is needed to verify the adequacy of the chosen model quantitatively and graphically. 4. EXPERIMENTATION AND RESULTS 4.1 Selection of Components of Mixture System In a mixture experiment, the total sum (mass or volume) of the mixture is settled, and the variables or segment settings are extents of the total sum for concrete, the whole of the volume portions is compelled to total to one. Since the volume divisions must whole to unity, the segment factors in a mixture experiment are not free. 4.2 Selection of Components of Mixture System The components of concrete mixture system are cement, silica fume, water and aggregate. The proportions of component of concrete mixtures are expressed by volume. The unit of volume is m3. The total volume of concrete mixture is unity i.e. 1 m3. The proportions of components of concrete mixture are input variables. 4.2.1 Cement 43 grade of Ordinary Portland Cement produced by BIRLA Cement limited conforming to IS: 12269-2013 is use in this research. The specific gravity of Portland cement is 3.15 which are measured using Le Chaterlier’s flask. The Twenty Value 2.65 1.15 7.070% 19% Value 2.65 @ IJTSRD | Unique Paper ID – IJTSRD25178 | Volume – 3 | Issue – 4 | May-Jun 2019 Page: 1491
International Journal of Trend in Scientific Research and Development (IJTSRD) @ www.ijtsrd.com eISSN: 2456-6470 Table 4.4: Minimum and Maximum Volume Fraction of Components of Concrete Mixture. Table 4.5: Minimum and Maximum Weight Fraction of Components of Concrete Mixture. Minimum weight fraction (kg/ m3) Cement 333.90 Silica fume 22.22 Water 180 Aggregate 1706.6 Minimum volume fraction (m3) 0.1060 0.01 0.180 0.644 Maximum volume fraction (m3) 0.1342 0.05 0.200 0.692 Maximum weight fraction (kg/ m3) 422.73 111.32 200 1833.8 Component Component Nomenclature Cement Silica fume Water Aggregate Table4.6: Linear constraints on proportions of components of concrete mixture Water to cementitious ratio Linear constraint 0 0 4.5 After selection of appropriate range of components, design points are generated. In this study, design points are generated according to d-optimal criteria by Design Expert Software. Design points are combinations on which the experiment is carried out. There are 4 coefficients in mathematical model thus 15 design points are generated according to d-optimal criteria. The design points (combinations of components) by volume are shown in Table 4.6 and by weight in Table 4.8 Due to complexity of experiment and due to limited design points, the coarse aggregate and fine aggregate variables are considered as single variable “Aggregate”. The main objective of study is focussed on three components cement, silica fume and water and the relative proportions of coarse aggregate and fine aggregate are deduced according to specifications given in IS:10262-2009. Design points in terms of cement, silica fume, water, coarse aggregate and fine aggregate are shown in Table 4.7 Table 4.7: design points by volume which is generated according to d-optimal design. Run order Cement (m3) Silica fume (m3) Water (m3) Aggregate (m3) 1 0.1342 0.0101 2 0.1314 0.0142 3 0.1286 0.0182 4 0.1271 0.0202 5 0.1243 0.0243 6 0.1229 0.0263 7 0.1215 0.0283 8 0.1201 0.0303 9 0.1158 0.0364 10 0.1130 0.0405 11 0.1116 0.0425 12 0.1102 0.0445 13 0.1088 0.0465 14 0.1074 0.0485 15 0.1060 0.0506 Table 4.8: Design points by volume in terms of cement, silica fume, water, coarse aggregate and fine aggregate. Run Order Cement (m3) Silica fume (m3) Water (m3) Coarse Aggregate (m3) Fine Aggregate (m3) 1 0.1342 0.0101 0.2 2 0.1314 0.0142 0.1852 3 0.1286 0.0182 0.2 4 0.1271 0.0202 0.1898 5 0.1243 0.0243 0.18 6 0.1229 0.0263 0.18 7 0.1215 0.0283 0.1906 8 0.1201 0.0303 0.194 9 0.1158 0.0364 0.2 10 0.1130 0.0405 0.18 11 0.1116 0.0425 0.2 12 0.1102 0.0445 0.18 13 0.1088 0.0465 0.1914 14 0.1074 0.0485 0.18 15 0.1060 0.0506 0.2 Design of Experiment 0.2 0.6557 0.6693 0.6532 0.6628 0.6714 0.6708 0.6596 0.6556 0.6477 0.6665 0.6459 0.6653 0.6533 0.6641 0.6435 0.1852 0.2 0.1898 0.18 0.18 0.1906 0.194 0.2 0.18 0.2 0.18 0.1914 0.18 0.2 0.4196 0.4283 0.4181 0.4242 0.4297 0.4293 0.4221 0.4196 0.4146 0.4266 0.4134 0.4258 0.4181 0.4250 0.4118 0.2360 0.2409 0.2352 0.2386 0.2417 0.2415 0.2375 0.2360 0.2332 0.2400 0.2325 0.2395 0.2352 0.2391 0.2317 @ IJTSRD | Unique Paper ID – IJTSRD25178 | Volume – 3 | Issue – 4 | May-Jun 2019 Page: 1492
International Journal of Trend in Scientific Research and Development (IJTSRD) @ www.ijtsrd.com eISSN: 2456-6470 Table 4.9: design points by weight in terms of cement, silica fume, water, coarse aggregate and fine aggregate. Run Order (Kg/M3) (Kg/M3) (Kg/M3) 1 422.73 22.22 200 2 413.91 31.24 185.2 3 405.09 40.04 200 4 400.365 44.44 189.8 5 391.545 53.46 180 6 387.135 57.86 180 7 382.725 62.26 190.6 8 378.315 66.66 194 9 364.77 80.08 200 10 355.95 89.1 180 11 351.54 93.5 200 12 347.13 97.9 180 13 342.72 102.3 191.4 14 338.31 106.7 180 15 333.9 111.32 200 Cement Silica Fume Water Coarse Aggregate (Kg/M3) 1111.94 1134.995 1107.965 1124.13 1138.705 1137.645 1118.565 1111.94 1098.69 1130.49 1095.51 1128.37 1107.965 1126.25 1091.27 Fine Aggregate (Kg/M3) 625.4 638.385 623.28 632.29 640.505 639.975 629.375 625.4 617.98 636 616.125 634.675 623.28 633.615 614.005 4.6 Responses corresponding to design point are measured by conducting laboratory experiment on design points. The responses measured are as follows: 1.28 days compressive strength. 2.Slump value. Three replicates of cubes of concrete are casted for each design point and after 28 days, compressive strength test is carry out as per IS: 516- 1959 to resolve compressive strength of concrete cubes for each design point. Compressive strength of cubes is measured on Compression Testing Machine (CTM). The unit of measurement of compressive strength is MPa. The rate of loading is 4 KN/sec. The workability of concrete is determined on the basis of slump value. The slump value for each design point is calculated according to specifications given in IS: 7320-1974. 4.7 Response The compressive strength at the age of 28 daysand slump value is measured for each concrete mix and test results are shown in table. Table 4.10: Responses of mixture which are measured in laboratory Run No. Average 28 days compressive strength (MPa) Slump value (mm) 1 24.3 2 26.3 3 28.42 4 30.62 5 33.32 6 37.52 7 34 8 32 9 30 10 28.42 11 27 12 26 13 25 14 24 15 24 4.8 Mathematical Model Fitting. The mathematical model for 28 days compressive strength is linear Scheffe’s cannonical polynomial as shown in equation. Laboratory Experiment 85 80 72 65 58 55 50 45 40 35 32 25 20 18 15 Where, 28 days compressive strength in MPa. Proportion of cement by volume (m3). Proportion of silica fume by volume (m3). Proportion of water by volume (m3). Proportion of aggregate by volume (m3). @ IJTSRD | Unique Paper ID – IJTSRD25178 | Volume – 3 | Issue – 4 | May-Jun 2019 Page: 1493
International Journal of Trend in Scientific Research and Development (IJTSRD) @ www.ijtsrd.com eISSN: 2456-6470 = Error of model And The mathematical model for slump value is also linear Scheffe’s cannonical polynomial as shown in equation. are coefficients of Scheffe’s cannonical polynomial equation of 28 days compressive strength. Where, Slump value in mm. Proportion of Cement by volume (m3). Proportion of silica fume by volume (m3). Proportion of water by volume (m3). Proportion of aggregate by volume (m3). = Error of model. And The data is obtained from test results and fitted to Scheffe’s cannonical polynomial equation by method of least square. The least square estimator can be shown in matrix form in equation. are coefficients of Scheffe’s cannonical polynomial equation of slump value. Where, , , The Y and X matrix are shown in Table 5.14. Table 4.11: X and Y matrix. X matrix Y matrix 0.1342 0.0101 0.1314 0.0142 0.1852 0.6693 0.1286 0.0182 0.1271 0.0202 0.1898 0.6628 30.62 0.1243 0.0243 0.18 0.1229 0.0263 0.18 0.1215 0.0283 0.1906 0.6596 0.1201 0.0303 0.194 0.1158 0.0364 0.2 0.1130 0.0405 0.18 0.1116 0.0425 0.2 0.1102 0.0445 0.18 0.1088 0.0465 0.1914 0.6533 0.1074 0.0485 0.18 0.1060 0.0506 0.2 0.2 0.6557 24.3 26.3 85 80 72 65 58 55 50 45 40 35 32 25 20 18 15 0.2 0.6532 28.42 0.6714 33.32 0.6708 37.52 34 32 30 0.6556 0.6477 0.6665 28.42 0.6459 0.6653 27 26 25 24 24 0.6641 0.6435 By using equation the least square technique, coefficients are calculated. The coefficients of Scheffe’s cannonical polynomial equation of 28 days compressive strength is shown in Table 4.11. Table 4.12: Coefficient of Scheffe’s Canonical Polynomial Equation of 28 Days Compressive Strength β1(1) Β2(1) -143.88 -146.92 -77.97 99.80 The mathematical model of compressive strength is Β3(1) Β4(1) @ IJTSRD | Unique Paper ID – IJTSRD25178 | Volume – 3 | Issue – 4 | May-Jun 2019 Page: 1494
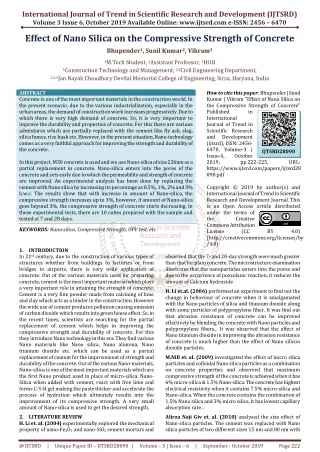
International Journal of Trend in Scientific Research and Development (IJTSRD) @ www.ijtsrd.com eISSN: 2456-6470 Where, The coefficients of Scheffe’s cannonical polynomial equation of slump value are shown in Table. 4.12 is the error of model. Table 4.13: Coefficient of Scheffe’s Cannonical Polynomial Equation of Slump Value β1(2) Β2(2) -526.46 -2266.93 Β3(2) Β4(2) 226 210 The mathematical model of slump value is Where, is the error of the model. Table 4.14 Error value for compressive strength and slump value For compressive strength model Error Error value 1 2 3 4 5 6 7 8 9 10 11 12 13 14 15 For slump model Error Error value Run order -4.75 -5.06 0 .62 1.81 6.16 4.68 3.43 3 -1.85 0.43 -3.96 -2.78 -4.66 -1.94 -4.35 -1.04 -1.41 -4.37 -3.14 -2.22 -3.47 -4.60 2.27 5.66 6.25 3.51 2.24 4.35 5.18 Figure 4.1: Response trace plot of residual value (Error) in compressive strength model @ IJTSRD | Unique Paper ID – IJTSRD25178 | Volume – 3 | Issue – 4 | May-Jun 2019 Page: 1495
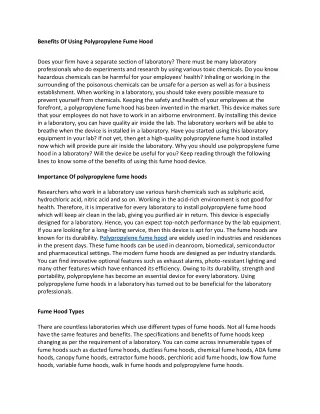
International Journal of Trend in Scientific Research and Development (IJTSRD) @ www.ijtsrd.com eISSN: 2456-6470 Fig 4.1 Shows the graph between residual (Error) and run order for compressive strength model. Maximum error is found in run order 06. Figure 4.2: Response trace plot of residual value (Error) in slump model Fig 4.2 Shows the graph between residual (Error) and run order for slump model. Maximum error is found in run order 11. 4.9 MATHEMATICAL MODEL VALIDATION Validation of mathematical model is done by Analysis of Variance (ANOVA). The analysis of variance (ANOVA) details are shown in table. In ANOVA, hypothesis testing is done. The null hypothesis is that there is no relationship between input variables and output variables and the alternative hypothesis is that there is relationship between input variables and output variables. The null hypothesis is And The alternative hypothesis is If there is relationship between dependent and independent variables, we reject null hypothesis and accept alternative hypothesis that there is relationship between response variable and input variables i.e. proportions of mixture. The null hypothesis is rejected when mean of sum of square of model is relatively large than mean of sum of squares of error because total sum of square is explained more by sum of squares of model than sum of square of error and if sum of square of error is large than model is not adequate. The ratio of mean of sum of square of model to mean of sum of squares of error follows F distribution. The means of total sum of square, model sum of square and error sum of square are given as Where, @ IJTSRD | Unique Paper ID – IJTSRD25178 | Volume – 3 | Issue – 4 | May-Jun 2019 Page: 1496
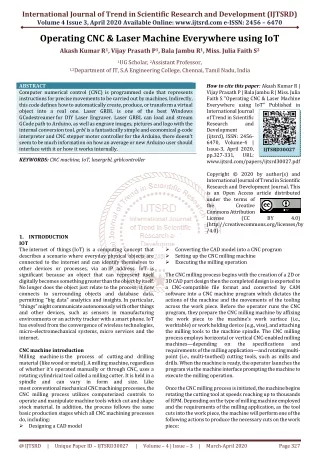
International Journal of Trend in Scientific Research and Development (IJTSRD) @ www.ijtsrd.com eISSN: 2456-6470 Where, = number of observations = number of coefficients in regression model The ratio of mean of model sum of square to mean of error sum of square F is given as If 4.10 VALIDATION OF TWENTY EIGHT DAYS COMPRESSIVE STRENGTH MODEL The calculation of ANOVA for twenty eight days compressive strength model is shown in Table 4.13 The value calculated is 1.56 which is greater than adequate. Table4.15: Analysis of variance calculations for mathematical model of compressive strength. Sum of Squares of Freedom Model 186.73 3 Residual 439.07 11 5. GRAPHICAL INTERPRETATION Response trace plot is plot between mean deviation of proportions from centroid of design points and response of mixture. So as to have a better understanding of effect of each component on the response, a trace plot is used. The slope of plot indicates the sensitivity of response to change in proportion of component. Table 5.1: The value of compressive strength & slump for different run order Run order Cement (m3) Silica fume (m3) 1 0.1342 0.0101 2 0.1314 0.0142 3 0.1286 0.0182 4 0.1271 0.0202 5 0.1243 0.0243 6 0.1229 0.0263 7 0.1215 0.0283 8 0.1201 0.0303 9 0.1158 0.0364 10 0.1130 0.0405 11 0.1116 0.0425 12 0.1102 0.0445 13 0.1088 0.0465 14 0.1074 0.0485 15 0.1060 0.0506 is relatively large than then value becomes large and if value is so large that it. value 0.2749 thus null hypothesis is rejected and model is Degree Mean of Sum of Square 62.24 39.92 F Critical For 95% Confidence Interval Source F Value 1.56 0.2547 Compressive Strength (Mpa) Slump Value 24.3 26.3 28.42 30.62 33.32 37.52 34 32 30 28.42 27 26 25 24 24 85 80 72 65 58 55 50 45 40 35 32 25 20 18 15 Figure 5.1: Response trace plot of 28 days compressive strength @ IJTSRD | Unique Paper ID – IJTSRD25178 | Volume – 3 | Issue – 4 | May-Jun 2019 Page: 1497
International Journal of Trend in Scientific Research and Development (IJTSRD) @ www.ijtsrd.com eISSN: 2456-6470 Figure 5.2: Response trace plot slump value The response trace plot of twenty eight days compressive strength for different run is shown in Figure 5.1. The Plot shows that compressive strength increases gradually up to 6th run. After that the compressive strength is decreased. The maximum compressive strength is found in model no 06. The response trace plot of slump value is shown in Figure 5.2. The Plot shows that the slump value decrease when proportion of silica fume is increased. Similarly response trace plot of compressive strength for % of replacement of silica fume shown in Figure 5.3. The plot show that the compressive strength is increased gradually up to 15%. And after that the value of compressive strength is decreased. Figure 5.3: Response trace plot of 28 days compressive strength. 5.1 The maximum 28 days compressive strength is 37.52 MPa. For obtaining the optimization, desirability function method is used. The criteria are to maximize the compressive strength, slump value, silica fume and minimize the cement. The calculations of optimization are shown in Table 5.2 and the solution of optimization is shown in Table 5.3 Table 5.2: Goals and criteria of optimization of 28 days compressive strength Name Goal Cement Minimize Silica fume Maximize Water In range Aggregate In range Compressive strength Maximize Slump value In rang Optimization using desirability function method Lower limit Upper Limit 0.1016 0.01 0.180 0.644 24 15 0.140 0.05 0.200 0.692 37.52 85 @ IJTSRD | Unique Paper ID – IJTSRD25178 | Volume – 3 | Issue – 4 | May-Jun 2019 Page: 1498
International Journal of Trend in Scientific Research and Development (IJTSRD) @ www.ijtsrd.com eISSN: 2456-6470 Table 5.3: Solution of optimization of 28 days compressive strength using desirability function method Cement (cu- m) (cu-m) (cu-m) (cu-m) 0.1229 0.0263 0.180 0.6708 Silica fume Water Aggregate Compressive strength (Mpa) 37.52 Slump value (mm) 55 6. CONCLUSION 1.Statistical mixture experiment method can be used for mixture proportioning of Silica fume blended concrete and normal concrete. 2.In statistical mixture experiment, smaller number of experiments is required to obtain meaningful data about concrete mixture than traditional trial and error method. 3.Simplex lattice and simplex centroid designs are not suitable for mixture proportioning of concrete because concrete ingredients usually vary between minimum level greater than 0 and maximum level less than 1. 4.D-optimal designs are suitable for concrete mixture proportioning. 5.The Mathematical model of 28 days compressive strength which is obtained in study is Where, 28 days compressive strength in MPa. Proportion of Cement by volume (m3). Proportion of silica fume by volume (m3). Proportion of water by volume (m3). Proportion of aggregate by volume (m3). = Error of model. This model is used to predict and optimize the 28 days compressive strength of silica fume blended concrete. 6.The mathematical model of slump value which is obtained in study is Where, Slump value in mm. Proportion of Cement by volume (m3). Proportion of silica fume by volume (m3). Proportion of water by volume (m3). Proportion of aggregate by volume (m3). = Error of model This model is used to predict and optimize the slump value of silica fume blended concrete. 7.The maximum compressive strength of 37.52 MPa is obtained for silica fume blended concrete. 8.The optimum level of silica fume is 15%. REFERENCES [1]Ajileye, F. V., 2012. Investigations on MicroSilica (Silica Fume) As Partial Cement Replacement in Concrete. Global Journal of researches in engineering Civil And Structural engineering, January.12(1). [2]D. C. Montgomery, Design and Analysis of Experiments: Response Surface Method and Designs, John Wiley & Sons, Inc., New Jersey, 2005. [3]Cornell, J. A., 1981. Experiments with mixtures design: models and analysis of mixture data. New York: John Wiley & Sons. [4]Murty, J. S. & Das, M. N., 1968. Design and Analysis of Experiments with Mixtures. The Annals of Mathematical Statistics, 39(5), pp. 1517-1539. [5]Ross, S. M., 2014. Introduction to Probability and Statistics for Engineers and Scientists. Fifth ed. s.l.:Elsevier. [6]Gambhir, M. L., 2012. Concrete Technology. Fourth ed. New Delhi: Tata McGraw Hill. [7]Scheffe, H., 1958. Experiments with Mixtures. Journal of Royal Statistical Society, Volume B20, pp. 344-360. [8]Shetty, M. S., 2012. Concrete Technology Theory and Practice. New Delhi: S. Chand & Company LTD. [9]Simon, M. J., Lagergren, E. S. & Snyder, K. A., 1997. Concrete Mixture Optimization using Statistical Mixture Design Methods. New Orleans, Louisiana, s.n. @ IJTSRD | Unique Paper ID – IJTSRD25178 | Volume – 3 | Issue – 4 | May-Jun 2019 Page: 1499