Download
1 / 7
70 likes | 84 Vues
This study focuses on the behaviour of soil foundation interaction under a bridge pier. In 2016, August 25, a magnitude of 6.8 happened near Bagan region. Pakokku Bridge, the longest of the bridges over the Irrawaddy, is situated on 37.8 miles from the epicentre of 2016 Chauk earthquake. That is why the safety performance of long span Bridge especially for the safety of the foundation system subjected to soil foundation interaction is necessary to investigate for static and seismic excitation. So, study on the behaviour of soil foundation interaction under Bridge pier in static condition is presented in this study. Firstly super structural loadings on the pile cap are estimated by using STAAD PRO V8i. And then, theoretical ultimate soil resistance pcr and pcd due to wedge and flow failure are determined to produce critical depth xcr. Based on the value of critical depth, p y curves are generated by Reese 1974 method for the static condition. After that, finite element software ABAQUS is used for the analysis of soil foundation interaction under a bridge pier. In this study, the behaviour of soil foundation interaction such as deflections, settlements, shear stresses and shear strains are produced. According to the analysis results, it is found that the vertical and horizontal displacements at the pile tip are 1.27mm and 4.68mm respectively. Maximum shear stress and strain are found out the base of the pile cap. Finally it is found that the soil foundation interaction under a bridge pier presented in this study is reliable and reasonable with the limitation of AASHTO Standard Specifications for Highway Bridges. Zin May Hnin | Nyan Myint Kyaw | Kyaw Kyaw "Study on Soil-Foundation Interaction under a Bridge Pier" Published in International Journal of Trend in Scientific Research and Development (ijtsrd), ISSN: 2456-6470, Volume-3 | Issue-1 , December 2018, URL: https://www.ijtsrd.com/papers/ijtsrd19008.pdf Paper URL: http://www.ijtsrd.com/engineering/civil-engineering/19008/study-on-soil-foundation-interaction-under-a-bridge-pier/zin-may-hnin<br>

E N D
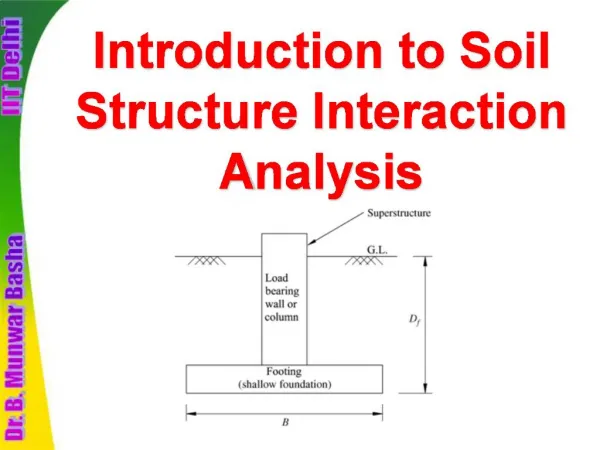
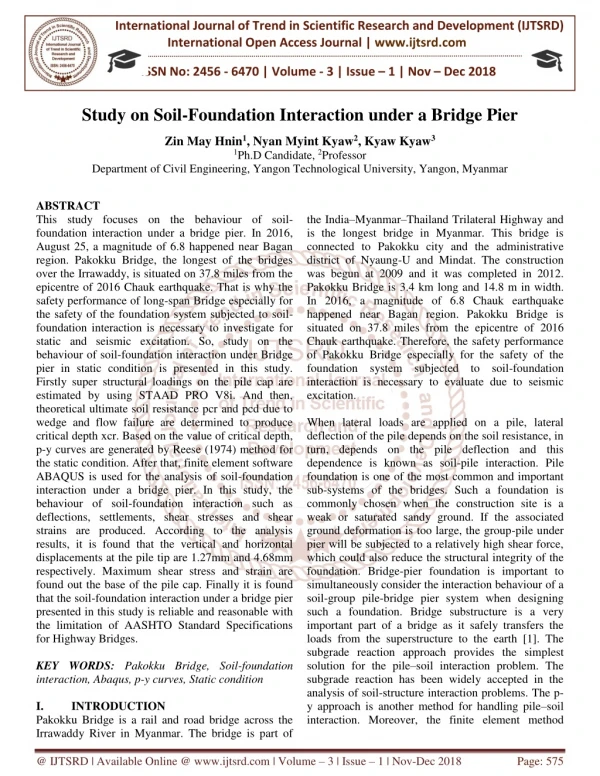
International Journal of Trend in Scientific Research and Development (IJTSRD) International Open Access Journal | www.ijtsrd.com ISSN No: 2456 - 6470 | Volume - 3 | Issue – 1 | Nov – Dec 2018 Study on Soil-Foundation Interaction under a Bridge Pier Zin May Hnin1, Nyan Myint Kyaw2, Kyaw Kyaw3 1Ph.D Candidate, 2Professor Department of Civil Engineering, Yangon Technological University, Yangon, Myanmar ABSTRACT This study focuses on the behaviour of soil- foundation interaction under a bridge pier. In 2016, August 25, a magnitude of 6.8 happened near Bagan region. Pakokku Bridge, the longest of the bridges over the Irrawaddy, is situated on 37.8 miles from the epicentre of 2016 Chauk earthquake. That is why the safety performance of long-span Bridge especially for the safety of the foundation system subjected to soil- foundation interaction is necessary to investigate for static and seismic excitation. So, study on the behaviour of soil-foundation interaction under Bridge pier in static condition is presented in this study. Firstly super structural loadings on the pile cap are estimated by using STAAD PRO V8i. And then, theoretical ultimate soil resistance pcr and pcd due to wedge and flow failure are determined to produce critical depth xcr. Based on the value of critical depth, p-y curves are generated by Reese (1974) method for the static condition. After that, finite element software ABAQUS is used for the analysis of soil-foundation interaction under a bridge pier. In this study, the behaviour of soil-foundation interaction such as deflections, settlements, shear stresses and shear strains are produced. According to the analysis results, it is found that the vertical and horizontal displacements at the pile tip are 1.27mm and 4.68mm respectively. Maximum shear stress and strain are found out the base of the pile cap. Finally it is found that the soil-foundation interaction under a bridge pier presented in this study is reliable and reasonable with the limitation of AASHTO Standard Specifications for Highway Bridges. KEY WORDS: Pakokku Bridge, Soil-foundation interaction, Abaqus, p-y curves, Static condition I. INTRODUCTION Pakokku Bridge is a rail and road bridge across the Irrawaddy River in Myanmar. The bridge is part of the India–Myanmar–Thailand Trilateral Highway and is the longest bridge in Myanmar. This bridge is connected to Pakokku city and the administrative district of Nyaung-U and Mindat. The construction was begun at 2009 and it was completed in 2012. Pakokku Bridge is 3.4 km long and 14.8 m in width. In 2016, a magnitude of 6.8 Chauk earthquake happened near Bagan region. Pakokku Bridge is situated on 37.8 miles from the epicentre of 2016 Chauk earthquake. Therefore, the safety performance of Pakokku Bridge especially for the safety of the foundation system subjected to soil-foundation interaction is necessary to evaluate due to seismic excitation. When lateral loads are applied on a pile, lateral deflection of the pile depends on the soil resistance, in turn, depends on the pile deflection and this dependence is known as soil-pile interaction. Pile foundation is one of the most common and important sub-systems of the bridges. Such a foundation is commonly chosen when the construction site is a weak or saturated sandy ground. If the associated ground deformation is too large, the group-pile under pier will be subjected to a relatively high shear force, which could also reduce the structural integrity of the foundation. Bridge-pier foundation is important to simultaneously consider the interaction behaviour of a soil-group pile-bridge pier system when designing such a foundation. Bridge substructure is a very important part of a bridge as it safely transfers the loads from the superstructure to the earth [1]. The subgrade reaction approach provides the simplest solution for the pile–soil interaction problem. The subgrade reaction has been widely accepted in the analysis of soil-structure interaction problems. The p- y approach is another method for handling pile–soil interaction. Moreover, the finite element method @ IJTSRD | Available Online @ www.ijtsrd.com | Volume – 3 | Issue – 1 | Nov-Dec 2018 Page: 575
International Journal of Trend in Scientific Research and Development (IJTSRD) ISSN: 2456-6470 (FEM) is the most powerful tool in modeling soil- structure interaction. The research described in this paper presents a numerical investigation of composite soil–foundation system. Firstly, checking the bearing capacity of Case Study Bridge is based on Shamsher Prakash [2] and compare pier loading and pile group capacity. After that, p-y curves are determined using the subgrade reaction approach according to Reese and Matlock [7]. The soil-foundation system is modelled and analyzed using Abaqus/Cae [5]. II. RESEARCHMETHODOLOGY The research study included structural investigation, soil investigation, modelling and analysis for the selected case study. The flow chart of this study is shown in Fig. 1. Fig. 1 Flow chart of the methodology III. STRUCTURALINVESTIGATION The selected case study, Pakokku Bridge is the longest bridge over the Irrawaddy River in Myanmar. It is composed of 6 main spans and 20 numbers of pier under the bridge. The superstructure of the bridge is composed of steel truss members, concrete deck slab, and I-beam girders. The behaviour of soil foundation interaction are analysed for the pier number 5 under the bridge of the middle span. The photo of Pakokku Bridge and case study of pier (PR 5) location are shown in Fig. 2 and Fig. 3, and the sectional elevation and plan view of case study are shown in Fig. 4 and Fig. 5 respectively. Fig.2 Pakokku Bridge Mid span of the bridge Fig.3 Study portion of Pakokku Bridge Study on Soil-Foundation Interaction under a Bridge Pier (a) Case Study (b) Fig 4: Sectional elevation (a) longitudinal and (b) transverse of case study (PR5) Structural Investigation Soil Investigation -Collected borehole data (, and N (number of blow)) -Structural Drawing -Calculation of the bearing capacity of bored pile -Development of p-y curves for laterally loaded piles -Modelling and Analysis for soil-pile interaction Fig. 5 Plan view of case study (PR5) Results and Discussion As shown in Figs. 4 and 5, pier under the bridge are composed of two column bents and supporting foundation with eighteen piles group. So there are two loading points, pier 1 and pier 2, on the pile cap. Table I and II present the information of pile and pile cap details, and material properties. Superstructural loadings on the pile cap are determined according to AASHTO. The factored loading from the superstructure on the pile cap are presented in Table III. TABLEIPile and Pile Cap Details No. of Pile (m x m x m) 5 18 24.6x11.8x2.75 Conclusion Pile Cap Dimension Diameter of Pile (m) 1.67 Pile Length (m) 18 Pier No. @ IJTSRD | Available Online @ www.ijtsrd.com | Volume – 3 | Issue – 1 | Nov-Dec 2018 Page: 576
International Journal of Trend in Scientific Research and Development (IJTSRD) ISSN: 2456-6470 TABLE.IIMaterial Properties Design strength of concrete (MPa) Yield strength of re-bar (MPa) characteristics of the soil. The effect of changed soil conditions are reflected in the nondimensional empirical coefficient Nq and mobilized shaft friction, fs, in cohesionless soils [2]. The final expression for ultimate load capacity, (Qv)ult of a pile then becomes (Qv)ult = Qp +Qf The ultimate end resistance Qp in tons of drilled or bored piles can be estimated by the following relationships For Sand, B / N 4 . 0 3 For cohesionless or nonplastic silt, ( A D B / N 4 . 0 3 The friction capacity of a pile The friction capacity of a pile can be estimated by using the following relationship: ( )( ) perimeter f 2 N fs= 1tsf Pier Pile 24 290 290 29 (1) TABLE.IIILoading of Structure on the Pile Cap Fx Fy Fz Mx (kN- m) 3x10 3 6x10 2 My (kN -m) Mz (kN- m) 23x10 3 13x10 3 Pie r (kN) (kN) (kN) 2x10 3 1x10 3 18x10 3 15x10 3 2x10 2 1 2.7 ( ) 4 1 p (2) p= N Q D A A f p 3 2 9.56 3.2 IV. Standard penetration test SPT N values, friction angle (), the compressive strength of soil (c) and unit weight of soil () are important parameters to analyze the behaviour of soil-pile interaction. The properties of soil under the pier 5 are shown in Table IV. According to the unified soil classification system, three type of soils are found such as Brownish Yellow SAND trace silt, Brownish Grey SAND trace silt and Light Brownish Grey SAND some silt trace clay. As shown in Table IV, the cohesion of soil, ‘c’ for every layers are zero and the internal friction angle of soil are ranging from 19.5 to 30.5. TABLE.IVProperties of Soil Depth z, (m) (kg/m3) 3 10 1853.4 6 19 1866.2 9 30 1912.6 12 23 1883.8 15 25 1845.3 18 22 1853.4 21 25 1895.0 24 30 1911.0 27 29 1907.8 30 29 1903.0 33 55 1946.3 36 75 1959.1 39 88 1965.5 42 118 1984.7 45 124 2008.7 V. CALCULATIONOFTHEBEARING CAPACITYOFBOREDPILE The bearing capacity of piles is, therefore, estimated based on initial strength ) 1 p (3) p= SOILINVESTIGATION Q N A f p 1 (Embedment length) (4) f= Q s (5) 50 where fs is the ultimate unit shaft friction in tons per square feet. (Qp)G = nQp, (6) where (Qp)G is ultimate point load of a pile group, (Qp) is the ultimate point load of a single pile and n is the number of piles [2]. The allowable bearing capacities of single pile and group piles of case study under the pier (PR5) are 3150.95 kN and 56717.09 kN. The pier loading from superstructure, 33108 kN, shown in Table III is less than the allowable bearing capacity of group piles. Therefore, design of foundation system under (PR5) is satisfied. VI. DEVELOPMENTOFP-YCURVES For the solution of the problem of a laterally loaded pile, it is necessary to predict a set of p-y curves. The p-y curves were evaluated form the basic procedure for developing p-y curves in the static condition (Reese et al., 1974) [7]. A.P-y Curvesof Laterally Loaded Piles in Cohesionless Soils for Static Condition The p-y method models a laterally loaded pile as a soil-structure interaction problem because the lateral load applied results in lateral deflection of the pile, C N (KN/m2) 0 0 0 0 0 0 0 0 0 0 0 0 0 0 0 (degree) 19.5 19.5 19.5 19.5 21.3 21.3 21.3 29.2 29.2 29.2 29.2 30.4 30.4 30.4 30.4 and deformation @ IJTSRD | Available Online @ www.ijtsrd.com | Volume – 3 | Issue – 1 | Nov-Dec 2018 Page: 577
International Journal of Trend in Scientific Research and Development (IJTSRD) ISSN: 2456-6470 which causes reactions in the soil. A static equilibrium between the pile and soil must be obtained. The numerical solution of the problem requires a relationship between the pile deflections and the soil reactions. Static p-y curves with different depth of soil for transverse and longitudinal directions of the pile group are developed according to Reese and Matlock [7]. Soil resistance and deflection are determined by using the following equations. + − tan cosα β tan ( tanα sin tan xtanβ K x 0 − + ( + − = K 1 tan x B K p 0 A cd where, , 2 B ym= , KA are necessary soil parameters for obtaining the value of xcr, at the interaction of pcr and pcd. The coefficients B1 and A1 are used for determining of pm and pu. The critical depth value xcr is obtained by plotting pcr and pcd with depth (x) on a common scale. Above the critical depth, pcr is taken for soil resistance and pcd is taken below the critical depth for p-y curves [2]. The evaluation of critical depth to develop p-y curves are shown in Fig. 6. The development of p-y curves for single pile of selected case study pile group are presented in Fig. 7. xtan sinβ tanβ K )( ) = + 0 B xtanβtanβ p γx ( ) ( cr − β ) (7) (8) − B K x A tan ) 4 8 B tan 1 1 , and 2 = + 45 β α = = − (9) A tan 45 K 2 m= p p B 1 c (10) Fig. 6 Critical depth 60 A B 3 (11) u= p p 1 c (12) yu= 80 p − p (13) u m = m − y y u m p = m (14) n m y m p (15) = m C 1 ( ) y mn ( ) − n n 1 C (16) = y k x n h 1 (17) = p C y n where, pcr , pcd = theoretical ultimate soil resistance due to wedge and flow failure pc = govern theoretical ultimate soil resistance pu = ultimate soil resistance yu = deflection at ultimate soil resistance pm = soil pressure at D/60 ym = deflection at soil pressure at D/60 p = establish initial straight line portion yk = deflection at establish initial straight line portion x = depth below the pile head = unit weight of soil = angle of internal friction Ko = coefficient of lateral earth pressure B = diameter of pile Fig. 7 p-y curves for single pile Evaluation of p-y curves for pile-group are determined by applying P-multipliers Pm. The determination of Pm for each case are; First (Lead) Row Piles: Pm = 0.26ln(S/D) + 0.5 ≤ 1.0 Second Row Piles Pm = 0.52ln(S/D) ≤ 1.0 Third or Higher Row Piles: Pm= 0.60ln(S/D) − 0.25 ≤ 1.0 @ IJTSRD | Available Online @ www.ijtsrd.com | Volume – 3 | Issue – 1 | Nov-Dec 2018 Page: 578
International Journal of Trend in Scientific Research and Development (IJTSRD) ISSN: 2456-6470 Where, S is center-to-center spacing between piles in the direction of loading and D is the width or outside diameter of the pile [6]. The development of p-y curves for transverse direction and longitudinal direction of group piles are shown in Fig. 8 and Fig. 9 respectively. The relationship between soil resistance and lateral deflection from Figs. 8 and 9 are used as the input parameters to get the bond strength between multilayer of soil and pile in finite element model for soil-foundation interaction analysis. Pile group model Fig. 10 Soil-foundation interaction finite element model A.Soil Modelling In the 3D soil modelling, the stiffness of the elastic surrounding soil is well accounted. The size of the soil model is 122m x 122m x 48m. The layered soil conditions are modelled using design parameters presented in Table I and possion’s ratio for sand is considered as 0.3 for all layers. The data derived correspond to every 3 m depth. So, the soil profile is approximated with 15 different layers. Modulus of elasticity for cohesionless soil is estimated using the following equation [2]: E = 750+80N ton/m2 B.Pile Group Modelling The concrete pile tube is considered to behave linearly elastic and modelled as a cylindrical structure. The size of the pier is 24.6 m x 11.6 m x 2.75 m and the pile group under the pier is made up of 18 with 1.67 m diameter. The material properties of pile group are as follows: E=25GPa, =23.58 kN/m3 and =0.2. C.Soil Pile Contact Modelling The interaction between the sand and the pile was modelled by defining tangential and normal contact behaviour in the finite element model. A master and slave surfaces were defined into the finite element model. The master surface was represented by the exterior surface of the pile, and the slave surface by the interior surface of the sand which was extruded according to the exact dimensions of the pile [5]. The tangential contact between the two surfaces was defined using a friction coefficient (tan (2 /3). The normal contact behavior of stiffness between the pile and soil was determined from p-y curves. The bond strength between pile and soil are considered as the stiffness between the pile and soil from p-y curves for the interaction analysis. D.Boundary Conditions In this model, the pile and soil were modelled using eight-nodded solid continuum elements (C3D8R) to account for the continuum nature of the soil in Abaqus/Cae. The bottom of the pile and soil model were fixed into the finite element model to simulate the embedment of the pile into the soil below a depth of 18 m and the exterior surface of the soil was (18) Fig.8 p-y curves for transverse direction Fig. 9 p-y curves for longitudinal direction VII. The approaches based on FEM analysis have the advantage of taking into account the initial conditions, nonlinear pile-soil interaction and nonlinear soil behaviour. In the current analysis, the model is composed of two parts named respectively ‘Soil’ and ‘Pile group’. Each of the parts is partitioned creating different layers for the soil and different sections for the pile. Figure 10 illustrated the model of soil- foundation using ABAQUS. SOIL-FOUNDATIONINTERACTION @ IJTSRD | Available Online @ www.ijtsrd.com | Volume – 3 | Issue – 1 | Nov-Dec 2018 Page: 579
International Journal of Trend in Scientific Research and Development (IJTSRD) ISSN: 2456-6470 constrained with multi-point constraints (MPC) constraints. This option is used to impose constraints between different degrees of freedom of the model [5]. E.Analysis of soil-foundation interaction Case studied foundation under the Bridge are two column bents pier so there are two points on the pile cap. Therefore, loads, superstructure are used presented in Table III and applied for x, y and z-directions respectively. Figures. 11 to 14 show horizontal and vertical displacements of piles group foundation under the pier due to the static response analysis. Figures. 15 and 16 show maximum shear stress and strain due to the static response analysis. and moments from Fig. 14 Vertical displacement of pile tip Fig. 15 Shear stress in static condition Fig. 11 Soil-foundation deformation due to static loads Fig. 16 Shear strain in static condition VIII.RESULTSANDDISCUSSIONS According to the soil investigation results presented Table IV, the cohesion of soil, ‘c’ for every layer are zero and the internal friction angle of soil are ranging from 19.5 to 30.5. The allowable bearing capacities of single pile and group piles of case study under the pier (PR5) are 3150.95 kN and 56717.09 kN respectively. The allowable bearing capacity of group piles of case study under the pier (PR5) is greater than the pier loading from superstructure. Therefore, design of foundation system under (PR5) is satisfied. And then, soil resistance and deflection are determined for p-y curves. The p-y curves are developed for longitudinal and transverse directions of the foundation under studied pier. Due to the pile group configuration, the resistances of soil in transverse direction are greater than longitudinal direction shown in Figs. 8 and 9. After developing the p-y curves, static response of the soil-foundation interaction are carried out using ABAQUS. The analysis results are provided in Figs. 11 to 16. As shown in Fig. 11, the displacement of the foundation at the top of pile cap is 5.727 mm. According to the Figs. 12 and 13, it is found that the deflection in longitudinal direction is larger than in transverse direction. The maximum deflection of 4.68 mm are found out at the pile tip in longitudinal direction. On Fig. 12 Transverse-deflection for all piles Fig.13 Longitudinal -deflection for all piles @ IJTSRD | Available Online @ www.ijtsrd.com | Volume – 3 | Issue – 1 | Nov-Dec 2018 Page: 580
International Journal of Trend in Scientific Research and Development (IJTSRD) ISSN: 2456-6470 REFERENCES 1.LU. C. W, GUI. M. W and LAI. S. C “A numerical study on soil–group-pile–bridge-pier interaction under the effect of earthquake loading,” Journal of Earthquake and Tsunami, 2014, VOL.8, No.1, 1_35. 2.S. Prakash, and H. D. Sharma, Pile Foundations in EngineeringPractice. John Wiley & Sons, Inc, 1990. 3.AASHTO (1977). Standard Specifications for Highway Bridges. 16th Edition (1996 with 1997 interims). American Association of State Highway and Transportation Officials, Washington, DC. 4.Y. K and MA. A “Numerical analysis of pile–soil interaction under axial and lateral loads” International Journal of Concrete Structures and Materials, Vol.8, No.3, pp.239–249, September 2014. 5.S. Helwany, Applied Soil Mechanics with Abaqus Applications. John Wiley & Sons, Inc, 2007. 6.Browm, D. A., O’Neill, M.W., Hoit, M., Nagger, E. H., Vay, M. M., and Charkraborty, S. 2001. Static and Dynamic Lateral Loading of Pile Groups. NCHRP Report. No.461. 7.Reese, L. C. and Matlock, H., Non-dimensional Solutions for Laterally Loaded Piles with Soil Modulus Assumed Proportional to Depth, Proceedings 8th Texas Coference on Soil Mechanics and Foundation Engineering, Austin, TX, 1956, pp. 1-41. the other hand, the maximum vertical displacement of 1.27 mm are found out at the pile tip presented in Fig. 14. Due to the analysis results presented in Figs. 15 and 16, the maximum principle stress and strain are found out at the base of the pile cap and pile tips. The value of maximum principle stress and strain are 3.691 x 10⁷ N/m2 and 0.001341 respectively. IX. CONCLUSION This study focuses on the behaviour of soil- foundation interaction under a bridge pier, and the selected case study is pier number 5 (PR5) under the bridge of the middle span in Pakokku Bridge. According to the analysis results, the deflection of longitudinal direction is larger than transverse direction, and the maximum deflection of 4.68 mm are found out at the pile tip in longitudinal direction. The maximum vertical displacement or settlement of 1.27 mm are found out at the pile tip. Finally it is found that the soil-foundation interaction under a bridge pier presented in this study is reliable and reasonable with the limitation of AASHTO Standard Specifications for Highway Bridges. ACKNOWLEDGMENT Firstly, the author wishes to acknowledge and thanks to all persons who kindly helped and supported her from beginning to finish. The author would like to express her great thanks to Department of Bridge, Ministry of Construction for supporting the necessary data. The author is sincerely thankful to all teacher, Department of Civil Technological University. Engineering, Yangon @ IJTSRD | Available Online @ www.ijtsrd.com | Volume – 3 | Issue – 1 | Nov-Dec 2018 Page: 581