Download
1 / 5
50 likes | 86 Vues
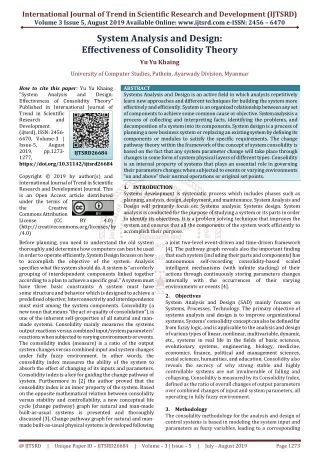
Systems Analysis and Design is an active field in which analysts repetitively learn new approaches and different techniques for building the system more effectively and efficiently. System is an organized relationship between any set of components to achieve some common cause or objective. System analysis is a process of collecting and interpreting facts, identifying the problems, and decomposition of a system into its components. System design is a process of planning a new business system or replacing an existing system by defining its components or modules to satisfy the specific requirements. The change pathway theory within the framework of the concept of system consolidity is based on the fact that any system parameter change will take place through changes in some form of system physical layers of different types. Consolidity is an internal property of systems that plays an essential role in governing their parameters changes when subjected to events or varying environments "on and above"u009d their normal operations or original set points. Yu Yu Khaing "System Analysis and Design: Effectiveness of Consolidity Theory" Published in International Journal of Trend in Scientific Research and Development (ijtsrd), ISSN: 2456-6470, Volume-3 | Issue-5 , August 2019, URL: https://www.ijtsrd.com/papers/ijtsrd26684.pdf Paper URL: https://www.ijtsrd.com/other-scientific-research-area/other/26684/system-analysis-and-design-effectiveness-of-consolidity-theory/yu-yu-khaing<br>

E N D
International Journal of Trend in Scientific Research and Development (IJTSRD) Volume 3 Issue 5, August 2019 Available Online: www.ijtsrd.com e-ISSN: 2456 – 6470 System Analysis and Design: Effectiveness of Consolidity Theory Yu Yu Khaing University of Computer Studies, Pathein, Ayarwady Division, Myanmar How to cite this paper: Yu Yu Khaing "System Analysis Effectiveness of Consolidity Theory" Published in International Journal of Trend in Scientific Research and Development (ijtsrd), ISSN: 2456- 6470, Volume-3 | Issue-5, August 2019, pp.1273- 1277, https://doi.org/10.31142/ijtsrd26684 Copyright © 2019 by author(s) and International Journal of Trend in Scientific Research and Development Journal. This is an Open Access article distributed under the terms of the Creative Commons Attribution License (CC (http://creativecommons.org/licenses/by /4.0) Before planning, you need to understand the old system thoroughly and determine how computers can best be used in order to operate efficiently. System Design focuses on how to accomplish the objective of the system. Analysis specifies what the system should do. A system is “an orderly grouping of interdependent components linked together according to a plan to achieve a specific goal.” A system must have three basic constraints: A system must have some structure and behavior which is designed to achieve a predefined objective; Interconnectivity and interdependence must exist among the system components. Consolidity (a new noun that means “the act or quality of consolidation”), is one of the inherent self-properties of all natural and man- made systems. Consolidity mainly measures the systems output reactions versus combined input/system parameters’ reactions when subjected to varying environments or events. The consolidity index (measure) is a ratio of the output system changes versus combined input and system changes under fully fuzzy environment. In other words, the consolidity index measures the ability of the system to absorb the effect of changing of its inputs and parameters. Consolidity index is a key for guiding the change pathway of system. Furthermore in [2] the author proved that the consolidity index is an inner property of the system. Based on the opposite mathematical relation between consolidity versus stability and controllability, a new conceptual life cycle (change pathway) graph for natural and man-made built-as-usual systems is presented and thoroughly discussed [3]. Change pathway graph for natural and man- made built-as-usual physical systems is developed following ABSTRACT Systems Analysis and Design is an active field in which analysts repetitively learn new approaches and different techniques for building the system more effectively and efficiently. System is an organized relationship between any set of components to achieve some common cause or objective. System analysisis a process of collecting and interpreting facts, identifying the problems, and decomposition of a system into its components. System design is a process of planning a new business system or replacing an existing system by defining its components or modules to satisfy the specific requirements. The change pathway theory within the framework of the concept of system consolidity is based on the fact that any system parameter change will take place through changes in some form of system physical layers of different types. Consolidity is an internal property of systems that plays an essential role in governing their parameters changes when subjected to events or varying environments “on and above” their normal operations or original set points. 1.INTRODUCTION Systems development is systematic process which includes phases such as planning, analysis, design, deployment, and maintenance. System Analysis and Design will primarily focus on: Systems analysis; Systems design. System analysis is conducted for the purpose of studying a system or its parts in order to identify its objectives. It is a problem solving technique that improves the system and ensures that all the components of the system work efficiently to accomplish their purpose. a joint two-level event-driven and time-driven framework [4]. The pathway graph reveals also the important finding that each system (including their parts and components) has autonomous self-recording intelligent mechanisms (with infinite stacking) of their actions through continuously storing parameters changes internally with the occurrences of their varying environments or events [4]. 2.Objectives System Analysis and Design (SAD) mainly focuses on Systems, Processes, Technology. The primary objective of systems analysis and design is to improve organizational systems. Systems' consolidity concept can also be defined far from fuzzy logic, and is applicable to the analysis and design of various types of linear, nonlinear, multivariable, dynamic, etc., systems in real life in the fields of basic sciences, evolutionary systems, engineering, biology, medicine, economics, finance, political and management sciences, social sciences, humanities, and education. Consolidity also reveals the secrecy of why strong stable and highly controllable systems are not invulnerable of falling and collapsing. Consolidity is measured by its Consolidity Index, defined as the ratio of overall changes of output parameters over combined changes of input and system parameters, all operating in fully fuzzy environment. 3.Methodology The consolidity methodology for the analysis and design of control systems is based in modeling the system input and parameters as fuzzy variables, leading to a corresponding and Design: IJTSRD26684 BY 4.0) consolidity-based scaled @ IJTSRD | Unique Paper ID – IJTSRD26684 | Volume – 3 | Issue – 5 | July - August 2019 Page 1273
International Journal of Trend in Scientific Research and Development (IJTSRD) @ www.ijtsrd.com eISSN: 2456-6470 output of the similar fuzzy nature. A system operating at a certain stable original state in fully fuzzy environment is said to be consolidated if its overall output is suppressed corresponding to their combined input and parameters effect, and vice versa for unconsolidated systems. Neutrally consolidated systems correspond to marginal or balanced reaction of output, versus combined input and system. In general, the output fuzziness behavior toward input fuzziness could differ from one system to another. Examples of these behaviors are as follows [1]: Let the positive ratio |FO/FI+S| defines the System Consolidity Index, to be denoted as FO/(I+S). Based on FO/(I+S) the system consolidity state can then be classified as [5], [6], [7]: Consolidated if FO/ (I+S) <1, to be referred to as “Class C”. Neutrally Consolidated if FO/(I+S)≈1, to be denoted by “Class N”. Unconsolidated if FO/ (I+S) >1, to be referred to as “Class U”. For cases where the system consolidity indices lie at both consolidated and unconsolidated parts, the system consolidity will be designated as a mixed class or “Class M”. The selection of the fuzzy levels testing scenarios for both the system and input should follow the same usual consideration. First of all the input and system fuzzy values for system consolidity testing are selected as integer values to be preferably in the range ±8 for open fuzzy environment and in the range ±4 for bounded fuzzy environments. Nevertheless, the output fuzzy level could assume open values beyond these ranges based on the overall consolidity of the system. However, all over implementation procedure in the paper, the exact fraction values of fuzzy levels are preserved during the calculations and are rounded as integer values only at the final results [8]. It is remarked that the typical ranges of the consolidity indices FO/(I+S) based on previous real-life applications are as follows: very low (<0.5), low (0.5–1.5), moderate (1.5–5),high (5–15), and very high (>15) [8], [9]. A good practical consolidated system should have the index FO/(I+S)⩽1.5. 3.1 The Consolidity Chart The concept of implementing the consolidity theory to the analysis and design of control system is to plot for each system its consolidity chart defined as the relation between the Output Fuzziness Factor |FO| in the vertical axis (y) and the Input and System Fuzziness Factor |FI+S| in the horizontal axis (x). The best way for sketching each system’s region in the consolidity chart is to calculate representative points of output fuzziness factor (y-axis) versus input and the system fuzziness factor (x-axis) and plot all these x–y points first in the chart. The average consolidity index is then calculated based on these points and its value will represent the slope of the center line of the region under study. The boundary of the region can then be sketched around this center line embodying all (or the majority) of these fuzziness x–y points. Examples of the consolidity regions or patterns of various consolidity classes are summarized in Table 1 and sketched in Fig. 1. The shapes of each region are assumed for simplicity of the elliptical. However, other geometric shapes such as the circular one could take place for various applications. Outputs could absorb the input fuzziness and give smaller or diminishing output fuzziness. Outputs could yield almost the same level of input fuzziness. Output could give higher output fuzziness compared to input fuzziness. Let us assume a general system operating in fully fuzzy environment, having the following elements: Input parameters: I̲= (VIi, ℓIi) Such that VIi, i=1, 2, …, m describe the deterministic value of input component Ii, and ℓIi indicates its corresponding fuzzy level. System parameters: S̲= (VSj , ℓSj) Such that VSj, j=1, 2, …, n denote the deterministic value of system parameter Sj, and ℓSj denotes its corresponding fuzzy level. Output parameters: O̲= (VOi, ℓOi) Such that VOi, i=1, 2, …, k designate the deterministic value of output component Oi, and ℓOi designates its corresponding fuzzy level. We will apply in this investigation, the overall fuzzy levels notion, first for the combined input and system parameters, and second for output parameters. As the relation between combined input and system with output is close to (or of the like type) of the multiplicative relations, the multiplication fuzziness property is applied for combining the fuzziness of input and system parameters. For the combined input and system parameters, we have the weighted fuzzy level to be denoted as the combined Input and System Fuzziness Factor FI+S, given as: For the combined input and system parameters, we have the weighted fuzzy level to be denoted as the combined Input and System Fuzziness Factor FI+S, given as: FI+S = ∑ ∑ ??? ??? ∑ ??? ??? Similarly, for the Output Fuzziness Factor FO, we have FO = ∑ ∑ ??? ??? (1) (2) (3) value of consolidity ? ??? ? .ℓ?? ? ??? ? ∑ ??? ???.ℓ?? + (4) ? ??? ??? .ℓ?? (5) ? @ IJTSRD | Unique Paper ID – IJTSRD26684 | Volume – 3 | Issue – 5 | July - August 2019 Page 1274
International Journal of Trend in Scientific Research and Development (IJTSRD) @ www.ijtsrd.com eISSN: 2456-6470 Table1: Various classifications of system Consolidity. Class abbreviation C All values of Consolidity Index are less than 1, that is FO/(I+S)<1 A mixed system that is clearly inclined more toward consolidation such as the center of gravity (averaged value) has FO/(I+S)<1 Ser. 1 Class name Consolidated Description 2 Quasi-consolidated C? Neutrally consolidated 3 N All values of Consolidity Index are nearly 1, that is FO/(I+S)≈1 All values of Consolidity Indices lie at both Consolidated and Unconsolidated zones, FO/(I+S)<and>1 A mixed system that is clearly inclined more toward un- consolidation such as the center of gravity (averaged value) has FO/(I+S)>1 All values of Consolidity Index are more than 1, that is FO/(I+S)>1 4 Mixed class M Quasi- 5 U? unconsolidated 6 Unconsolidated U carried out for adjusting one or more of system key parameters or possibly controlling existing operating environment to attain improved consolidity without jeopardizing their stability or performance. This interfering approach for existing systems is illustrated in Fig. 2(a). Fig1. The Consolidity chart showing six different classes of system consolidity patterns (regions) as described in Table 1. Based on these consolidity patterns, the degree of susceptibility of the system to withstand the effect of changes in system and input parameters can be evaluated. In fact, Consolidity index is an important factor in scaling system parameter changes when subjected to events or varying environment. For instance, for all coming events at say event state μ which are “on and above” the system normal situation or stand will lead to consecutive changes of parameters. Such changes follow the general relationship at any event step μ μ = Function [consolidity μ, event μ] [10], [11]. Two important common cases in real life of such formulation are the linear (or linearized) and the exponential relationship. 3.2 Implementation approach of Consolidity theory to control systems 3.2.1. Implementation approach for existing control systems For the existing man-made or natural systems, the situation could be complicated. The testing of these existing systems could reveal the poor consolidity of such system. This is quite expected as we previously used to build all existing systems without considering the new concept of system consolidity. For existing man-made systems, the situation could be possible by altering parameters of the system within the utmost extent permitted for changes. As for natural systems, the system consolidity improvement matter could also be possible by interfering within the system parameters together with environment and trying to direct the physical process toward better targeted consolidity. For existing automatic control systems, they could be firstly examined for their consolidity behavior. Based on the obtained results, appropriate interventions are Fig2: Implementation approach of consolidity theory for both existing and new systems under design. 3.2.2.Implementation approach for new control systems design For new automatic control implementation of consolidity theory is much simpler. The designers commence using the conventional automatic control techniques leaving at the end one or more flexible (or changeable) parameters that consecutively be adjusted for preserving good system consolidity behavior. Several designs could be developed and then ranked within the framework of consolidity for selecting the best choices that also fulfill acceptable degrees of functionality. The approach is also applicable for higher dimensional automatic control as it is based mainly on matrix formulations. For design analysis, conventional techniques are first used leaving one or two parameters of flexible ranges. The suggested consolidity technique can then be drawn by varying these parameters to obtain an improved design from the consolidity point of view. In general, as the generation of these prototypes during the design process is not completely exhaustive. The terms of superior or inferior of consolidation remain as relative comparison. Such comparison is sufficient for all real-life applications as the system designers could follow later other cycles of improvement to locate a new better superior system that surmounts the old superior design. Such building approach for new systems is elucidated in Fig. 2(b). It is remarked that during implementation each as: Δ Parameter varying change environment or systems design, the @ IJTSRD | Unique Paper ID – IJTSRD26684 | Volume – 3 | Issue – 5 | July - August 2019 Page 1275
International Journal of Trend in Scientific Research and Development (IJTSRD) @ www.ijtsrd.com eISSN: 2456-6470 problem as symbols and not be substituted (with fuzziness defined as their pairs or shadows). Conventional mathematics is then applied to the basic variables while the appropriate fuzzy algebra is implemented on their corresponding pairs or shadows (fuzziness). Parameters substitutions are made at the end step of solution leading to the calculation of the consolidity factors as specified by the problem analyst. For complicated symbolic manipulations (and computations) the use of Matlab Symbolic Toolbox, Mathematica or similar like software libraries could be highly effective to foster the consolidity theory through conducting its necessary derivations. This will enable the implementation of the consolidity analysis to wider classes of linear, nonlinear, multivariable and dynamic problems with different types of complexities. 3.3 Systems comparison based on the consolidity indices implementation results The first step in the design of any specific problem is to carry out the consolidity indices of all various available scenarios. These results are extracted from only one overall consolidity index based on the design philosophy to be followed. Examples of such design basis are given as: Average consolidity scores: In this case, the average of all scored consolidity indices for each scenario is calculated and used solely for the selection of the most appropriate consolidated design. Weighted average consolidity scores: For the situations where the possibility of the input and system fuzziness is known, the weighted average values of the consolidity by these given possibilities are calculated and the results are used in the selection of design. Worst consolidity scores: In this case, the worst score of the consolidity index is chosen as an overall evaluation index. This could be the maximum (or minimum) of all scored indices if we are seeking the superior (or inferior) consolidated design Another in-depth direction of comparisons is through plotting regions (patterns) of fuzziness behavior in the sketched consolidity chart similar to the ones shown in Fig. 1. It could appear from such figure that each consolidity region changes from system to another and follows certain geometric shapes such as the elliptical, circulars, or others. The geometric features of each consolidity region can be characterized by the following features: Symbol Description Type of consolidity region shape such as elliptical, circular, or other shapes Slope or angle in degrees of the centerline of the geometric shapes of the overall consolidity index S(degrees) = tan−1(overall consolidity index) The centroid of the geometric shape expressed by its horizontal coordinate per unit (pu) and the vertical coordinate per unit A Area of the geometric shape of R in pu2 Length of geometric (major) diagonal in direction of slope of the consolidity region (pu) Length of geometric (minor) diagonal in perpendicular to the slope S of the consolidity region (pu) L2/L1 Diversity ratio of consolidity points (unitless) parameters should be addressed first The comparison or ranking of each consolidity region will be based on less slope, less area and less diversity ratio (L2/L1). Moreover, the position of the centroid C=(x,y) (upward or downward) within the geometric shape main centerline depends mainly on the nature of the affected input influences which are particular for each specific application. Higher values of such centers mean higher fuzzy input effects or influences. The above shown features of the consolidity charts will be the basis of the analysis of the various applications given in the following sections of the paper. 4.Conclusion Consolidity Application to Engineering Many engineering design applications such as electric circuits, mechanical machines, civil structural systems, chemical processes, and other engineering systems depend at one step or another on some assumptions or empirical formulas made to the best of engineers knowledge. For this, the designing engineers feel self-importance for the freedom they got in making such arbitrary selection of physical parameters during the design cycle. At the end of the cycle, the engineers will provide good designs with high external functionalities. Engineers could get much improved superior (or inferior) consolidated systems if they exerted additional efforts to ingeniously adjust the physical parameters (rather than selecting them in arbitrary manner) to satisfy system consolidity target requirements. Engineers will gain by applying consolidity in their design their peace of mind that their systems can withstand fully future failures or malfunctions when subjected to any wearing or deteriorations or upon operating in varying environment. Reference [1]Walaa Ibrahim Gabr. “A new approach for automatic control modeling, analysis and design in fully fuzzy environment”; Department of Electrical Engineering, Benha Engineering Faculty, Benha University, Egypt Received 17 September 2014; revised 17 December 2014; accepted 31 January 2015 Available online 1 April 2015; Ain Shams Engineering Journal (2015) 6, 835–850. [2]Hassen T. Dorrah “Consolidity: Mystery of inner property of systems uncovered”, Elsevier Journal of Advanced Research;doi:10.1016/j.jare.2011.11.002, Volume 3, October 2012, p. 345-58. URL address: http://www.sciencedirect.com/science/article/pii/S20 90123211001238 [3]Hassen T. Dorrah. Consolidity: Moving opposite to built-as-usual practices. Engineering doi:10.1016/j.asej.2012.7.004. http://www.sciencedirect.com/science/article/pii/S20 90447912000536 R Elsevier Journal Ain Shams (2012), address: URL S [4]Hassen T. Dorrah. Supplement to “Consolidity: Moving opposite to built-as-usual practices.” Elsevier Ain Shams Engineering doi:10.1016/j.asej.2013.2.009. http://www.sciencedirect.com/science/article/pii/S20 90447913000348 C=(x,y) Journal URL (2013), address: L1 L2 [5]Dorrah HT, Gabr WI. Foundations of new systems’ consolidity theory using arithmetic fuzzy logic-based representation in fully fuzzy environment. In: @ IJTSRD | Unique Paper ID – IJTSRD26684 | Volume – 3 | Issue – 5 | July - August 2019 Page 1276
International Journal of Trend in Scientific Research and Development (IJTSRD) @ www.ijtsrd.com eISSN: 2456-6470 Proceedings of 6th annual IEEE conference on automation science and engineering (IEEE CASE), Toronto, Ontario, Canada, August 21–24; 2010. p. 624– 631. Paper No. MoC2.1. Eng dx.doi.org/10.1016/j.asej.2014.09.014 [and also, ASEJ 2015; 6(1):181-197]. J 2015. http:// [9]Dorrah HT. Consolidity: moving opposite to built-as- usual systems practices. Elsevier Ain Shams Eng J 2012. http:// dx.doi.org/10.1016/j.asej.2012.7.004 [and also, ASEJ 2013;4(2):221–39]. [6]Dorrah HT, Gabr WI. Development of new consolidity heory for systems’ analysis and design in fully fuzzy environment. Int J Expert Syst Appl 2011. http://dx.doi.org/10.1016/ i.eswa.2011.07.125 [and also ESWA 2012; 39(1):1191–9]. [10]Dorrah HT. Consolidity: stack-based systems change pathway theory elaborated. Elsevier Ain Shams Eng J 2014. http:// dx.doi.org/10.1016/j.asej.2013.12.002 [and also ASEJ 2014;5(2):449–73]. [7]Dorrah HT. Consolidity: mystery of inner property of systems uncovered. Elsevier J Adv Res 2011. http://dx.doi.org/10.1016/ j.jare.2011.11.002 [and also JARE 2012;3(4):345–58]. [11]Dorrah HT. Toward a new ‘‘Fractals-general science’’. Elsevier Alexandria Eng J Short Commun 2014. http://dx.doi.org/10.1016/ j.aej.2014.07.003 [and also AEJ 2014; 53(3):505–12]. [8]Gabr WI. Consolidity analysis of fuzzy functions, matrices, probability and statistics. Elsevier Ain Shams @ IJTSRD | Unique Paper ID – IJTSRD26684 | Volume – 3 | Issue – 5 | July - August 2019 Page 1277