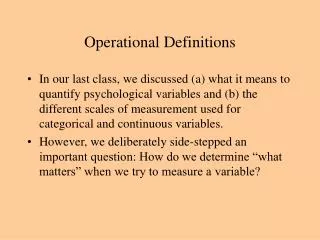
Operational Definitions
Operational Definitions. In our last class, we discussed (a) what it means to quantify psychological variables and (b) the different scales of measurement used for categorical and continuous variables.

Operational Definitions
E N D
Presentation Transcript
Operational Definitions • In our last class, we discussed (a) what it means to quantify psychological variables and (b) the different scales of measurement used for categorical and continuous variables. • However, we deliberately side-stepped an important question: How do we determine “what matters” when we try to measure a variable?
Simple Example • Let’s consider a relatively simple example: Let’s try to measure crying. • Before we can do so, we need to decide “what counts” as crying behavior. • Examples:
Definition of an Operational Definition • It is critical that the set of rules, or operations, that we use to measure a behavior be explicit and as clear-cut as possible. • These rules, or operations, constitute the operational definition of a variable.
Complex Example • Now let’s consider a more complex variable: theexperience of humor. • Whether or not someone finds something funny is a much more abstract (i.e., less tangible) thing to measure than crying. • In-Class Example: Two sets of operational definitions, and three students listening to jokes.
Important Distinction • Latent vs. Observed variables • An observed variable, like crying, is directly observable and can be measured easily. • A latent variable or construct is not directly observable. Instead, it is inferred from variables than can be observed.
Measuring Latent Variables • Latent variables can be measured, but their measurement is much more complicated than that of observed variables. • The first thing we need to do is identify, usually on an intuitive or theoretical basis, the scale of the latent variable. Is it categorical or continuous? • Next, we need to identify the indicators of the latent variable (i.e., the observable consequences or manifestations of the latent variable).
Measuring Latent Variables • Let’s answer the following question: Someone who finds something funny should be likely to behave in the following ways: __________. • These things (e.g., laughing), operationally defined, of course, can be considered as observable indicators of the unobserved state of “finding something humorous.”
Measuring Latent Variables • So, to operationally define a latent variable, we need to (a) specify the scale of the variable, (b) identify the observable manifestations of that latent variable, and (c) operationally define those observable manifestations. • Next, we need to know how the operational definitions of the observable variables map onto the latent variable.
Mapping • This mapping tends to be handled differently by different researchers. • Two considerations: • How many indicators to use? • Can we assume a linear relationship between the measured variables and the latent variable?
How many indicators? One > 1 Equivalence relation (Simplest) Multiple linear indicators (Simple) Linear Mathematical Mapping Single non-linear relationship (Complex) Multiple non-linear indicators (Very Complex) Nonlinear
Equivalence Relationship • Simplest case: The equivalence relationship. In this case, we use one indicator and assume that the relation between the latent variable and the manifest variable is linear. • Example: We may operationally define laughing, and then measure humor as if it is equal to laughing.
For each extra laugh, we assume the person thought the joke was one unit more funny Someone who laughs 8 times would get a humor score of 8. Laughing Humor
Equivalence Relationship • Advantages: • Explicit and straight-forward • Doesn’t require complicated mathematics • Other researchers can easily determine what you did • Disadvantages: • Behaviors are influenced by many things. Thus, part of what you’re measuring may be unrelated to the latent variable of interest. • Latent variables manifest themselves in a variety of ways. By focusing on one variable, our measurements are not as rich or compelling.
Multiple linear indicators • A better scenario, but more difficult to work with, is to use multiple indicators under the assumption of a linear relationship. • Example: Attraction
We assume that when someone is attracted to someone else (a latent variable), that person is more likely to have an increased heart rate, talk more, and make more phone calls (all observable variables). heart beat talking phone calls attraction
heart beat talking phone calls attraction attraction attraction We assume that each observed variable has a linear relationship with the latent variable. Note, however, that each observed variable has a different metric (one is heart beats per minute, another is time spent talking). Thus, we need a different metric for the latent variable.
allow the lowest measured value to represent the lowest value of the latent variable Observed allow the highest measured value to represent the highest value of the latent variable the line between these points maps the relationship between them Latent
heart beat talking phone calls attraction attraction attraction After the relationship has been specified between the latent variable and each measured variable, the latent scores for each measured variable can be averaged to scale the person on the latent variable. In this example: (2 + 0 + 3)/3 = 5/3 = 1.67
Multiple linear indicators • Advantages • By using multiple indicators, the uniqueness of each one gets washed out by what is common to each of them • Disadvantages • More complex to use • There is more than one way to scale the latent variable, thus, unless a scientist is very explicit, you might not know exactly what was done to obtain the measurements.
Multiple linear indicators: Caution • On that last note, I should mention an important problem. • When using multiple indicators, researchers typically sum or average the scores to scale people on the construct • Example: time spent talking + heart rate = LOVE Person A: 2 + 80 = 82 Person B: 3 + 120 = 123
Multiple linear indicators: Caution • Why may this be a problem? • First, the resulting metric for the latent variable doesn’t make much sense. Person A: 2 minutes talking + 80 beats per minute = 82 minutes talking/beats per minute???
Multiple linear indicators: Caution • Second, the variables may have different ranges. • If this is true, then some indicators will count more than others.
Multiple linear indicators: Caution • Variables with a large range will influence the latent score more than variable with a small range Person Heart rate Time spent talking Total A 80 2 82 B 80 3 83 C 120 2 122 D 120 3 123 * Heart rate has a greater range than time spent talking and, therefore, influences the total score more (i.e., the score on the latent variable)
Operational Definitions • In psychology, there is an interesting assortment of variables that we try to measure • Some variables are concrete and observable (e.g., kissing); others are abstract (e.g., love)