Download
1 / 68
700 likes | 910 Vues
Combining Money Management, Portfolio Metrics, and Strategies for Investing and Trading . Discussed by: Paul Grems Duncan Leader, Tri-State Investors Group July 16, 2001. Today’s Topics. Metrics – a few that will help your trading/investing

E N D
Combining Money Management, Portfolio Metrics, and Strategies for Investing and Trading Discussed by:Paul Grems DuncanLeader, Tri-State Investors Group July 16, 2001
Today’s Topics • Metrics – a few that will help your trading/investing • Three strategies that appear to be working right now • Effective Volume Overview and a review of some candidate stocks
Admin • Example files are located in my forum at http://forums.effectivevolume.com • Directions on how to access these files are at the end of the presentation.
Portfolio Metrics: Do We Care? • Yes! • Portfolio Metrics help us understand whether the changes we make to a portfolio are beneficial. • To use metrics though, you have to keep some form of log… (which I will provide an example… )
My Favorite Portfolio Metrics • Calmar Ratio • Mathematical Expectation • Pessimistic Return Ratio • There are others (Sharpe Ratio, Sortino Ratio, Upside Potential Ratio, etc.) but they are more difficult to understand and apply consistently (in my opinion).
The Concept of Drawdown • What is Drawdown (DD)? • Drawdown is the measurement from the maximum (equity, price) peak to the lowest value AFTER the peak. • Perceived Drawdown is: • the mechanism that causes us to sell a stock in a decline, resulting in us locking in losses rather than having confidence in our mechanical systems. • the enemy of mechanical trading. • There IS a distinction between intra-trade DD and end-of-trade DD – end-of-trade is far more important!
Calmar Ratio • What is the Calmar Ratio? CR is a very simple metric that relates return to drawdown. • Easy to remember: • If CR < 0, your CAR is negative, and you’re losing money. This is a bad system. • If CR ~ 1, Reward to Risk is 1:1. In general, you lose a dollar for every dollar gained, but time frame is important. • If CR = 2, for every dollar lost, you gain 2 dollars. Good system. • If CR = 3, for every dollar lost, you gain 3 dollars. Great system! • Practical, winning systems generally have a CR > 1.50
Example of CR = 0.82(CRR = 30.5%, MDD = 37.4%), 12/2/08 to 12/2/09 AAII Accelerated EPS Strategy (Modified Shadow Stock Portfolio Criteria)
Example of CR = 5.07(CRR = 41.6%, MDD = 8.20%), 5/4/09 to 5/4/10 AAII Accelerated EPS Strategy (Modified Shadow Stock Portfolio Criteria)
Steps to Track Calmar Ratio • 1) You need your equity curve, either real or backtested. • 2) Download CR-CalculationExample.xls at my forum at Effective Volume (once you’ve registered, of course).
CR Moves with Time!(Thankfully, Not Fast) 1996 – 2010, AAII Accelerated EPS Strategy (Modified Shadow Stock Portfolio Criteria) We’ll discuss how to use CR and timers to improve a strategy later in the presentation Average = 2.02+/- 1.31 Stdev Ugliness Ugliness Ugliness
Criticisms of CR • The definition uses the compounded annual return (CAR); this isn’t practical for short bursts of trades as the time frames do not align. Trades occurring in a 4-week burst do not extrapolate to 12 months very well. • Correspondingly, many people simply use total return (if less than 1 year) and the actual MDD. The purists will shutter, but this latter method works until a solid history per strategy is developed.
Mathematical Expectation • What is Mathematical Expectation (ME)? • ME is the “average take-home” amount in a trade scaled by the % of winning trades for the strategy (you have a strategy, right?) • All you need is: • Average winning trade amount • Average losing trade amount • % winning trades for the strategy • In the long haul, ME MUST BE > 0.
ME Example • A strategy has demonstrated a record of only 20% winning trades. • The average profit per trade is $10K • The average loss per trade is $2K • Is this a winning strategy? • Where: AW = average winning trade amount • AL = average losing trade amount • PW is the % winning trades
ME Example (con’t) • In the long run, this example should be profitable, as the ME is shown to be > 0.
Steps to Track ME • 1) You need to start tracking your trades with a log. • 2) You need to track what strategy is being used for a specific trade (you DO have (a) strategy(ies), right?) • 3) Download “ME-PRR-CalculationExample.xls” from my forum at Effective Volume – this is a log that auto-calculates ME.
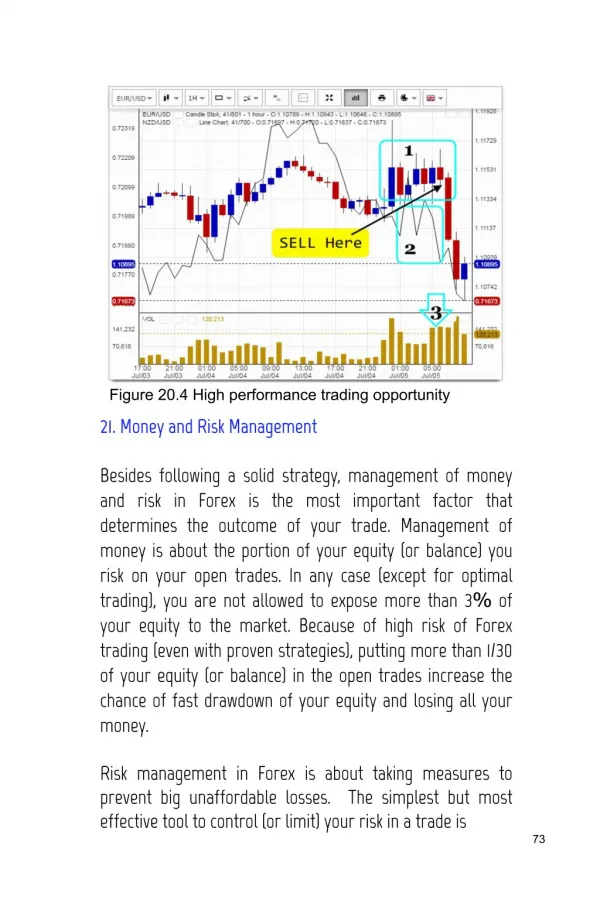
Example Trade Log for Autocalculating ME Worksheet Auto-calc’s VariousParameters Enter Tradesby Strategy ME-PRR-CalculationExample.xls
Pessimistic Return Ratio (PRR) • Pessimistic WHAT? • Created by Ralph Vince and published in “Portfolio Management Formulas” (ISBN 0-471-52756-4), this is a REALLY good method to understand your profitability and whether your methods will work in the longer haul. • PRR is like ME but it gets better as the number of trades increases.
Pessimistic Return Ratio • Here’s how PRR is defined: • W is the number of winning trades • L is the number of losing trades • AW is the average winning trade amount • AL is the average losing trade amount • Per Vince: PRR > 2.0 are good systems. PRR > 2.5 are excellent systems. • Also per Vince: We need at least 24-28 trades in a system to know whether it’s a viable system
PRR Example • Suppose we have a system with 13 winning trades, 5 losing trades, with $288 taken home on each trade that is won, and with ($33) lost on each trade that goes against our methods.
Steps to Track PRR • 1) Download “ME-PRR-CalculationExample.xls” from my forum at Effective Volume – this is a log that auto-calculates PRR (yes, this is the same file that also calculates ME).
Review of Metrics • Calmar Ratio: Compares gain to drawdown. Tells you if you’re taking too much risk (DD > gain is bad) • Mathematical Expectation: The “edge” of a strategy – we want positive numbers only here. • Pessimistic Return Ratio: the best of the three, it tells us how good a strategy is, and it improves as the number of trades goes up
AAII Shadow Stock Portfolio • Standard AAII portfolio: http://www.aaii.com/model-portfolios/stock-rules • Focuses on Small Cap stocks between $17 and $200M in size • Performance over last year has been quite good, but historically?
AAII MSSP PerformanceActual vs. Modeled, 1997-2010, corr = 0.816 Avg CR = 3.49 +/- 5.14 MDD = ~49%
AAII MSSP Performance • The assumption here is that the modeled performance is “adequate” at corr = 0.816 (1.0 = perfect, 0.0 = no correlation) • The drawdown of 49% would most likely have caused most to bail long before this occurred, then losing out to subsequent gains in 2009 and 2010. • The average CR of 3.50 is very, very good, but, the standard deviation of +/- 5.14 suggests major losses (3.5 – 5.1 CR < 0 – BIG PROBLEM) • How to stabilize CR by reducing MDD?
Improving AAII MSSP Performance “Market Cap Favoritism” – There are certain periods in the cycle that Small Caps underperform Favor Small Caps1/03 – 9/08 Favor Large Caps 6/06 – 5/08 10/08 – 3/09 Favor Small Caps 6/08 – 9/084/09 - Present Chart is the RATIO of Russell 1000 (Large Caps) to Russell 2000 (Small Caps) – R2K is in the Denominator
AAII MSSP PerformanceGated w/ Russell 1K/2K Favoritism Avg CR = 4.59 +/- 5.76 MDD = ~28%
Stockcharts can Assist in Analysis http://stockcharts.com/h-sc/ui?s=IWB:IWM&p=D&yr=3&mn=0&dy=0&id=p46574665355 Ratio is below trend – Small caps are looking better, so watch for it Green = Small Cap Favoritism
AAII MSSP Conclusions • It’s possible to use CR (as well as other metrics) to quantify adjustments to a strategy. • The AAII MSSP strategy is a good strategy, but management of the drawdown must occur or we’ll lose confidence in the system. • The general trend of favoring large caps or small caps certainly helps to provide confidence that we’re not running with small caps when the large caps are dominating. • Right now it appears that small caps are just coming into favor again
Mean Reversion Strategies • What is Mean Reversion? • Mean reversion is when a stock or ETF gets overbought or oversold to the extent that after some period of time, buyers/sellers converge and move the price to the mean. • Markets generally are in a trend or are mean-reverting. It’s important to have tools for each market. • Larry Connors and Cesar Alvarez have developed a number of strategies to take advantage of this phenomenon
A Comment on Mean Reversion Strategies • The psychology of mean reversion is opposite to that of trend trading. • In trend trading, you add to your position as it increases. • In mean-reversion trading, you add to your position as it falls • If you are not prepared to see negative numbers, then in trendless markets, you may be better suited to sit on the sidelines.
Favorite Connors’ Mean Reversion Strategy • Connors calls it “TPS” for Time-Price-Scale In • This is an aggressive strategy • Focused on ETFs • You “scale-in” to a position as the price drops on the long side in a 10%-20%-30%-40% fashion (which equals a 100% position when all done) • Connors’ has conducted much of his work using 20, non-leveraged, highly-liquid ETFs • What are the specific rules of this strategy?
Connors’ TPS Strategy (Long) • 1) ETF is above the 200d MA • 2) RSI(2) is below 25 for two days in a row. Buy 10% at the close. • 3) If prices are lower on the close than your previous entry, buy 20% at the close • 4) Repeat #3 until you attain 40% • Exit on the close when the 2-period RSI closes above 70 • A PDF copy of Connor’s book has been uploaded into the Effective Volume forum; there are more details there. • How has the strategy performed?
Connors’ TPS Strategy (Long) 20 ETF Inception to 12/31/08 20 ETF from 1/1/09 to 7/15/11 405 Trades Average % P/L = 1.67% Average Holding Time = 5d % Number Winners = 93% ME: 0.203 • 1159 Trades • Average % P/L = 1.45% • Average Holding Time = 6d • % Number Winners = 89%
Connor’s TPS Strategy (Long)Trade Distribution, 1/1/09 to 7/15/11 Note that there are a few trades that fell -14%
Connors’ TPS Strategy (Short) 20 ETF Inception to 12/31/08 20 ETF from 1/1/09 to 7/15/11 59 Trades Average % P/L = 1.39% Average Holding Time = 6d % Number Winners = 75% ME: 0.163 • 648 Trades • Average % P/L = 1.97% • Average Holding Time = 6d • % Number Winners = 81%
Connor’s TPS Strategy (Short)Equity Curve, 1/1/09 to 7/15/11
Connor’s TPS Strategy (Short)Trade Distribution, 1/1/09 to 7/15/11 Note that there are a few trades that fell -12%
Optimizing Connor’s TPS Strategy • One criticism that I have of this strategy is that it can tie up capital. On the bottom of the previous equity graphs there is a graph to the Number of Open Positions. For the non-leveraged ETFs, this could be close to all 20 positions. • What about using leveraged ETFs, and simply reduce the position size? • This next test uses the Direxion +/- 3x Leveraged ETFs
Connors’ TPS Strategy (3x Long) 1x 20 Long ETF 1/1/09 to 7/15/11 3x ETF from 1/1/09 to 7/15/11 163 Trades Average % P/L = 4.33% Average Holding Time = 5d % Number Winners = 89% ME: 0.492 • 405 Trades • Average % P/L = 1.67% • Average Holding Time = 5d • % Number Winners = 93% • ME: 0.203
Connor’s TPS Strategy (3x Long)Trade Distribution, 1/1/09 to 7/15/11 Note that there is 1 trade that fell >60%
Connors’ TPS Strategy (-3x Short) 1x 20 Short ETF 1/1/09 to 7/15/11 -3x ETF from 1/1/09 to 7/15/11 70 Trades Average % P/L = 1.53% Average Holding Time = 8d % Number Winners = 74% ME: 0.091 • 59 Trades • Average % P/L = 1.39% • Average Holding Time = 6d • % Number Winners = 75% • ME: 0.163
Connor’s TPS Strategy (-3x Short)Trade Distribution, 1/1/09 to 7/15/11 Note that there is 1 trade that fell >30%
Connors’ TPS Strategy Conclusions • TPS has a positive ME in all 4 cases (non-leveraged, leveraged, long, short). • The greatest “edge” (ME) is going long with the +3x Leveraged Direxion ETFs, followed by going long with the +1x original ETFs that Connor tested. • The greatest net gain per trade is long with the +3x Leveraged ETFs ( +4.33%/trade), followed by long the +1x original ETFs (+1.67%/trade)
The IWM and GDX Robots • Pascal Willain and Billy O’Nair have created two very focused, mechanical trading systems that are available at the Effective Volume web site which are profitable. • The first system, which uses IWM and related ETFs, is based upon the 20d Money Flow, established using Pascal’s Effective Volume tools, as well as precise entries/exits using pivot levels, statistics, and risk/reward ratios. This is a combination mean-reversion and trend-following system. • The second system, which uses GDX, is based upon money flow, looking specifically for extremes, then fades these situations. This is a mean reversion system. • These two instruments were chosen because they are not highly correlated. • Detailed FAQs can be found on the Effective Volume site, under the heading “Robots”. You must be a registered member to view.