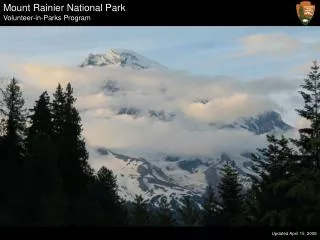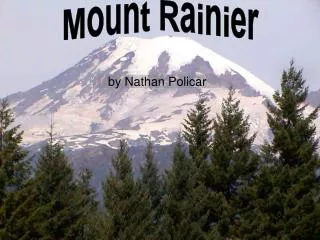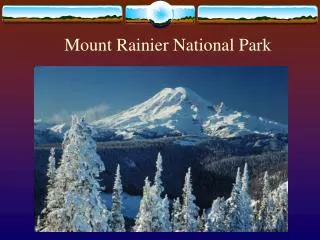
Mount Rainier Evacuation Plan
Mount Rainier Evacuation Plan. CPT Cardy Moten III, USA LT Volkan Sozen , Turkish Army. Outline. Background Problem Assumptions Model Overview Results Further Research Questions. Background. Pierce County Mount Rainier Lahars Volcanic Mudflows

Mount Rainier Evacuation Plan
E N D
Presentation Transcript
Mount Rainier Evacuation Plan CPT Cardy Moten III, USA LT VolkanSozen, Turkish Army
Outline • Background • Problem • Assumptions • Model Overview • Results • Further Research • Questions
Background Pierce County Mount Rainier Lahars Volcanic Mudflows Can occur with or without an eruption Examples Mount Saint Helens (1980) Columbia (1985) Africa (2012)
Background Impact Major residential areas inhabitable Portions of I-5 and other state roads inaccessible Port of Tacoma 75% of goods for Eastern and Central US 70% of consumer goods for Alaska
Problem • Short term (No Eruption) • Early warning from lahar detection system only • Analyze total number not evacuated • Given: • 2 hours • 43,395 vehicles • Varying lahar travel times
Problem • Long term (Eruption) • Analyze total required evacuation time • Given: • 727,635 evacuees • Various warning horizons • Same evacuees
Simplifying Assumptions • All households have one vehicle for evacuation • Total passengers per vehicle was an average of four • Transportation routes will be utilized to max capacity with serious gridlock. • Some personnel will evacuate even if they aren’t in danger, causing an uptick in network utilization.
Network Overview 110 80 40 Lahar travel time in minutes from time of detection
Seattle Simplified Graph Short Term Evacuation Scenario Renton Safe Node Roadway Transit Node N Kent Gig Harbor Evacuation Node Federal Way Auburn Tacoma Enumclaw Sumner Puyallup Buckley Greenwater Wilkeson Carbonado Orting Graham Yelm Mckenna Lacey Eatonville Mount Rainier Alder Ashford Elbe Packwodd Randle Morton Castle Rock
Seattle Renton Roadway N Kent Gig Harbor Federal Way Auburn Tacoma Enumclaw Sumner Puyallup Buckley Greenwater Wilkeson Carbonado Orting Graham Yelm Mckenna Lacey Eatonville Mount Rainier Alder Ashford Elbe Packwodd Randle Morton Castle Rock
Seattle Simplified Graph Long Term Evacuation Scenario Renton Safe Node Roadway Transit Node N Kent Gig Harbor Evacuation Node Federal Way Auburn Tacoma Enumclaw Sumner Puyallup Buckley Greenwater Wilkeson Carbonado Orting Graham Yelm Mckenna Lacey Eatonville Mount Rainier Alder Ashford Elbe Packwodd Randle Morton Castle Rock
Model Overview • Modeled for min cost flow • Used time layered format • Only major state and interstate roads for edges • Considered lahar reach time for each city Time = n+2 0,0,∞ 1,0,∞ End Time = n+1 C,0,UB Time = n
Model Overview • Values on edges are (C,LB,UB): • C = Travel times • Lower Bound(LB) = 0 • Upper Bound(UB)=Edge capacity • 30 vehicles for state roads • 80 vehicles for interstate • Total population for end node Time = n+2 0,0,∞ 1,0,∞ End Time = n+1 C,0,UB Time = n
Model Overview • Short-term evacuation graph (small model) • 80 time layers • 6,247 nodes • 14,118 edges • Long-term evacuation graph(large model) • 1000 time layers • 80,081 nodes • 295,486 edges
Short-Term Evacuation Results w/o Interdicion Puyallup River • Undirected Travel Lanes • Could not evacuate a total of 13 cities. • Percentage of households stranded was 45% • Network Design • Directed Travel Lanes • Met demand for all danger areas except 15% of Puyallup’s population • Not all of Puyallup’s citizens live near the Puyallup river • Recommend opposite traffic flow on 33 roads
Seattle Simplified Graph Undirected Travel Short Term Evacuation Scenario Renton Safe Node Roadway Transit Node N Kent Gig Harbor Evacuation Node Federal Way Auburn Tacoma Enumclaw Sumner Puyallup Buckley Greenwater Wilkeson Carbonado Orting Graham Yelm Mckenna Lacey Eatonville Mount Rainier Alder Ashford Elbe Packwodd Randle Morton Castle Rock
Seattle Simplified Graph Directed Travel Short Term Evacuation Scenario Renton Safe Node Roadway Transit Node N Kent Gig Harbor Evacuation Node Federal Way Auburn Tacoma Enumclaw Sumner Puyallup Buckley Greenwater Wilkeson Carbonado Orting Graham Yelm Mckenna Lacey Eatonville Mount Rainier Alder Ashford Elbe Packwodd Randle Morton Castle Rock
Interdiction Model Results • Interdicted short-term plan • Two-way travel only • Attacks isolated personnel in: • Puyallup • Sumner
Long-Term Evacuation Results • No Interdiction • Total evacuation time is 15 hours • Total-run time for the model took 24 minutes • Interdiction • Best attack was to shut off route to Castle rock in the south • Total evacuation time is 16.1 hours • Total run-time for the model took 86 minutes
Seattle Simplified Graph Long Term Evacuation Scenario Renton Safe Node Roadway Transit Node N Kent Gig Harbor Evacuation Node Federal Way Auburn Tacoma Enumclaw Sumner Puyallup Buckley Greenwater Wilkeson Carbonado Orting Graham Yelm Mckenna Lacey Eatonville Mount Rainier Alder Ashford Elbe Block here Packwodd Randle Morton Castle Rock
Further Research • Emplace more roadblocks on the long-term scenario • Conduct a fine-grain analysis on the short-term evacuation of Puyallup • Minimize the evacuation of the last household to leave the region
Data • Evacuation planning data extracted from the Pierce County Evacuation Plan (2008) • Population data is from the US Census American Fact Finder website http://factfinder2.census.gov/faces/nav/jsf/pages/index.xhtml • Highway capacities estimated from thesis submitted by LCDR April Malveo (2013)