Download

1 / 66
660 likes | 771 Vues
Dive into the search for extraterrestrial neutrinos using advanced data analysis techniques. Discover recent developments, challenges, and conclusions in this intriguing field of study.

E N D
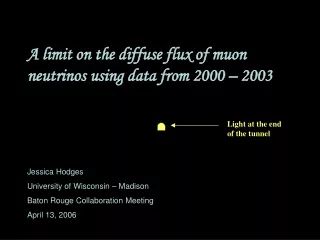
Update on diffuse extraterrestrial neutrino flux search with 2000 AMANDA-II data Jessica Hodges, Gary Hill, Jodi Cooley This version of the presentation has been expanded to include work done after the meeting – where part of the nch problem was found to be related to no cross-talk cleaning in the cascade fit
Review of previous work Jodi Cooley’s thesis work – presented Mons October 2003 • Basic quality cuts • 2-D cut against coincident muons • 2-D cut against nch>50 and positive smoothness – likelihood ratio track/shower vs ldirc • 2-D on cogz versus l.r. track/shower • model rejection potential optimised on nch
Review of previous work • Cuts developed on 50% of data • After nch>80 cut – 6 events on atmospheric background of 3.3 • Second 50% of data yielded 4 events • Combined 100% data • nch>87 – 9 events on atmospheric background of 4.5 • One event believed to be a coincident muon • What does this excess mean?
New developments • Reinvestigation of coincident muons using new dcorsika simulations • Discovery that the nch>50, positive smoothness cut isn’t justified (which was suggested by others earlier!) • Very recently started checking things with second 50% data, but only for nch less than 80 (less than where the cut would be)
The 50<nch<80, positive smoothness problem • Jodi noticed a bump in the nch distribtion above 50 channels
The 50<nch<80, positive smoothness problem • nch>50, big excess at positive smoothness
The 50<nch<80, positive smoothness problem • nch>50, big excess at positive smoothness
ldirc versus l.r. track/shower First half of data set
ldirc versus l.r. track/shower First half of data set
ldirc versus l.r. track/shower Second half of data set
ldirc versus l.r. track/shower Second half of data set
Summary of the 50<nch<80, positive smoothness problem • Expect 14.1 atmospheric neutrinos • First half data – 35 events • Second half data – 15 events • After cut – expect 8.2 atmos • First half data – 9 events • Second half data – 7 events
Summary of the 50<nch<80, positive smoothness problem • 26 events on 5.9 is quite a fluctuation • 34 events on 10.8 is as well…. • ….even accounting for all the plots I’ve looked at in my life
Full year nch plot Still a bump in the full year
Full year smoothness plot Still an excess at positive smoothness
Examine the 34 events • Look at distributions, both 1 and 2 dimensional • See if any of the events lie in “bad” corners of the cut space – indicative of background
line fit velocity Excess at slow velocities
smoothness, ndirc Excess at largest smoothness Excess at largest ndirc!
likelihood ratios, up/down, track/shower Maybe trend to lower ratios Tendency to lower ratios as seen already
ldirc, ldirb Nothing obviously bad
Cosine zenith, nch Maybe less vertical than expected Higher nch as observed already
Distributions of the 34 events Looks ok
Distributions of the 34 events Maybe a pileup toward low speed and high smoothness
Distributions of the 34 events No obvious disagreement
My conclusions about nch>50, positive smoothness • Some of the 34 events are some kind of unsimulated background, some are good track events • The difference between the two data halves is certainly a fluctuation on these underlying distributions • Hard to imagine a periodic signal that just happens to coincide with our data separation by file numbers
My conclusions about nch>50, positive smoothness • Some of these events are very nice tracks with long direct lengths • Eliminate the original cut – maybe look at cutting on line fit velocity vs smoothness • Tighten other cuts • Good events will survive to higher levels • Bad events will get eliminated elsewhere • See what happens in subsequent years
Passing rates with tightened cuts • Start with cuts just described • Tighten gradually until events disappear • Examine passing rates of data and simulation
Passing rates with tightened cuts • l.r. up to zenith-weighted downgoing fit - jkchi(12)-jkchi(11) = 35 - 53 • ldirb(11) = 10 - 28 • ndirc(11) = 155 - 200 • | smootallphit(11) | = 0.275 - 0.05 • 10 cut sets defined (40 - 49)
Limit setting potential versus cut level E2(E) < 2.35 10-7 GeV-1 cm-2 s-1 sr-1
The cut against coincident muons • Original cut: slope 18 • New cut: slope 4
The cut against coincident muons • Original cut: slope 18 • MRF : 0.2348
The cut against coincident muons • New cut: slope 4 • MRF : 0.2379
Outlook for the 2000 diffuse analysis • Some sort of weird effect was seen in the 1st 50%, but not in the 2nd • Eliminate the problematic cut • Tighten cut against coincident muons
Explanation of one part of the nch>50, positive smoothness problem • Clue (Doug Cowen) – cascade fit is very sensitive to noise hits • If the Monte Carlo and data have slightly different noise, then a cascade fit comparison might not make sense
The cascade fit was performed before the cross talk filter was applied! • Cascade fits on data have been done with all the cross talk present • Monte Carlo contains no cross talk • Likelihood ratios based on different hit selections make no sense
track/shower l.r. before nch>50 cut Dramatic improvement in the agreement of this variable!
track/shower l.r., ldirc vs t/s l.r. for nch>50, positive smoothness
Place a new cut – data and atmos neutrinos are now both split about 50:50 about this cut
Place a new cut – data and atmos neutrinos are now both split about 50:50 about this cut