Download
1 / 56
1.11k likes | 2.37k Vues
Insulin Therapy and Other Management Issues in Type 1 Diabetes Mellitus. Philip Raskin, MD Jaime A. Davidson, MD. The University of Texas Southwestern Medical Center. Treatment Guidelines for Diabetes. American Diabetes Association 1 HbA1c <7.0% Preprandial BG 70–130 mg/dL

E N D
Insulin Therapy and Other Management Issues in Type 1 Diabetes Mellitus Philip Raskin, MD Jaime A. Davidson, MD The University of Texas Southwestern Medical Center
Treatment Guidelines for Diabetes • American Diabetes Association1 • HbA1c <7.0% • Preprandial BG 70–130 mg/dL • Postprandial BG <180 mg/dL • American Association of Clinical Endocrinologists2 • HbA1c ≤6.5% • Preprandial BG <110 mg/dL • Postprandial BG <140 mg/dL • International Diabetes Federation • HbA1c <6.5%3,4 • Preprandial BG <110 mg/dL3,4 • Postprandial BG <160 mg/dL4 1. American Diabetes Association. Diabetes Care. 2012;35(suppl 1):S11-S63. 2. AACE. EndocrPract. 2011;17(suppl 2):1-53. 3. IDF. Global Guideline for Type 2 Diabetes. 2005. 4. IDF. Guideline for Management of PostMeal Glucose in Diabetes. 2011.
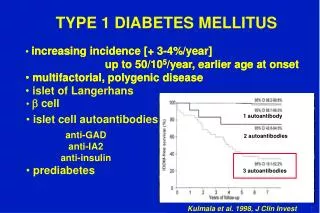
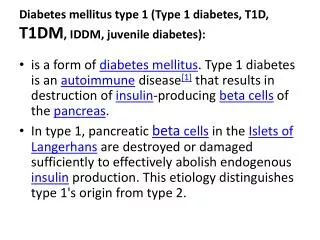
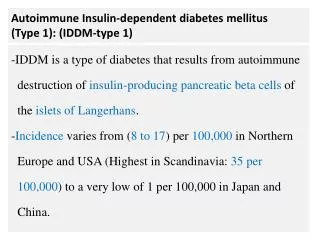
Type 1 Diabetes Mellitus • Type 1 (immune-mediated beta cell destruction leading to absolute insulin deficiency) • Dependent on exogenous insulin • Prone to ketoacidosis • Usually lean, but not always • Recent weight loss • Abrupt onset of symptoms, often before age 30 • May occur at any age
PUTATIVE ENVIRONMENTAL TRIGGER HUMORAL AUTOANTIBODIES (ICA, IAA, Anti-GAD65, IA2Ab, etc.) CLINICAL ONSET Natural History of Type 1 Diabetes CELLULAR (T CELL) AUTOIMMUNITY LOSS OF FIRST PHASE INSULIN RESPONSE (IVGTT) BETA CELL MASS GLUCOSE INTOLERANCE (OGTT) GENETIC PREDISPOSITION INSULITIS BETA CELL INJURY “PRE”-DIABETES DIABETES TIME With permission from Skyler JS, et al. Diabetes. 2011;60:1-8.
As Early as Possible in the Course of Diabetes When to Initiate Intensive Therapy in Type 1 Diabetes? • Metabolic Memory: Benefits of good diabetes control are long-lasting in both type 1 and type 2 diabetes1,2 • Intensive diabetes control in older diabetic individuals with long-standing Type 2 diabetes and well-established microvascular and macrovascular complications can result in bad outcomes (ACCORD, etc)?3 • DCCT/EDIC Study Research Group. N Engl J Med. 2005;353:2643-2653. • UKPDS Group. N Engl J Med. 2008;359:1577-1589. • 3. ACCORD Study Group. N Engl J Med. 2011;364:818-828.
DCCT Microvascular Complication Event Rates RetinopathyProgression1 LaserRx1 Microalbuminuria2 Albuminuria2 ClinicalNephropathy3 1.DCCT Research Group. Ophthalmology. 1995;102:647-661. 2. DCCT Research Group. Kidney Int. 1995;47:1703-1720. 3. DCCT Research Group. Ann Intern Med. 1995;122:561-568.
Further Retinopathy Progression Over 7 Years of EDIC from the Level at DCCT Closeout • Even after intensive therapy was stopped at the end of DCCT, effects of intensive therapy persisted for >7 years • Difference between conventional and intensive therapy accelerated even after the treatments ended • After 7 years of EDIC • Risk reduction: 62% with intensive therapy (95% CI 51%-70%, P <.001) DCCT/EDIC Research Group. JAMA. 2002;287:2563-2569.
Meta-analysis: Improved Glucose =Reduction in Macrovascular Events • With reduction in glucose, there is greater improvement in macrovascular events in glucose T1DM vs T2DM* Cardiac events T1DM 0.41 (95% CI, 0.19–0.87) T2DM 0.91 (95% CI, 0.80–1.03) Combined incidence Any macrovascular event T1DM 0.38 (95% CI, 0.26–0.56) T2DM 0.81 (95% CI, 0.73–0.91) Peripheral vascular events T1DM 0.39 (95% CI, 0.25–0.62) T2DM 0.58 (95% CI, 0.38–0.89) Cerebrovascular events T1DM 0.34 (95% CI, 0.05–2.57) T2DM 0.58 (95% CI, 0.4–0.74) *Incidence rate ratios are shown for T1DM (based on 8 randomized studies) and T2DM (based on 6 randomized studies). Stettler C, et al. Am Heart J. 2006;152:27-38.
Insulin Analog Insulin produced by technology that uses recombinant DNA to produce an insulin molecule that is slightly different from human insulin in structure as well as pharmacokinetic/ pharmacodynamic properties
Class Human Insulin Premixed Human Insulin Insulin Analogs Premixed Insulin Analogs Insulin Preparations Agents Regular, NPH Human 70/30 Insulin aspart, glulisine and lispro, insulin glargine and detemir Insulin lispro 75/25, 50/50 Biphasic insulin aspart 70/30
Time Action Profiles of Insulin Products • Rapid-acting insulin analogs (insulin aspart, insulin glulisine, insulin lispro) • Duration of action: 4–6 hours • Regular insulin • Duration of action: 8–10 hours • NPH insulin • Duration of action: 12–18 hours • Long-acting insulin analogs (insulin glargine, insulin detemir) • Duration of action: 20–24 hours
Rapid-Acting Analogs vs Regular Human Insulin 800 700 600 500 400 300 200 100 0 800 700 600 500 400 300 200 100 0 Rapid-Acting Analogs Regular Human Insulin Insulin Level (mU/mL) Glucose Insulin Rate (mg/min) 0 1 2 3 4 5 6 7 8 0 1 2 3 4 5 6 7 8 Time (hours) Time (hours) 0.05 U/kg (n = 6) 0.1 U/kg (n = 9) 0.2 U/kg (n = 9) 0.3 U/kg (n = 3) With permission from Woodworth, et al. Diabetes. 1993;42(suppl 1):54A.
Comparison of Insulin Absorption by Injection Site Tmax (hours)* Rapid-Acting Analogues Regular Human Insulin 1.0 3.8 0.77 1.3 3.1 1.0 * 0.2 U/kg sc. Braak EW, et al. Diabetes Care. 1996;19:1437-1440.
Intensive Diabetes Management Defined by • Goals of Therapy • Tools of Therapy • Systems of Therapy
Intensive Diabetes Management Goals • Near-normal glycemia • Near-normal glycohemoglobin • Prevention of complications • Absence of hypoglycemia
Intensive Diabetes Management Elements of Management • Multiple-component insulin regimen • Daily blood glucose monitoring • Careful balance of food intake, activity, and insulin dosage • An action plan for patient adjustment of the above, and the use of insulin supplements • Defined target blood glucose levels (individualized)
Intensive Diabetes Management Elements of Management • Frequent contact between patient and health care providers • Patient education and motivation • Psychological support • Assessment (glycohemoglobin)
Intensive Diabetes Management Components of Insulin Replacement • Basal • Meal-related
Basal/Bolus Idealized Absorption of Analog Insulin 75 50 25 0 Bedtime Lunch Breakfast Dinner Lispro/Aspart/Glulisine Plasma Insulin (U/mL) Glargine/Detemir 4:00 8:00 12:00 16:00 20:00 24:00 4:00 8:00 Time Courtesy of Davidson JA.
Insulin Pump Delivery Rapid-Acting Analogs Bolus Bolus Bolus 100 B L D 80 60 U/mL 40 Continuous infusion for basal delivery 20 0600 1800 0800 1200 2400 0600 B=breakfast; L=lunch; D=dinner Time of Day Courtesy of Davidson JA.
Intensive Diabetes Management Insulin Dose Distribution • Basal: 40%–60% • Premeal: 40%–60% • If according to carbohydrate • 0.8–1.2 units/gram carbohydrate • If according to % of total daily dose • 15%–25% before breakfast • 15% before lunch • 15%–20% before dinner
Intensive Diabetes Management Preprandial Algorithms • Insulin dosage • Insulin timing • Meal size • Meal content
Intensive Diabetes Management Insulin Dose Changes • Supplements • Adjustments
Intensive Diabetes Management Insulin Dose Changes • Supplements • Compensatory • Anticipatory
Intensive Diabetes Management Insulin Dose Changes • Compensatory supplements • Based on prevailing blood glucose • Corrects blood glucose outside “target” range • Alters basic dose for that point in time
Blood glucose <50 mg/dL 51–100 mg/dL 101–150 mg/dL 151–200 mg/dL 201–250 mg/dL 251–300 mg/dL >300 mg/dL Fast-acting insulin Decrease 2 units Decrease 1 unit Take usual dose Increase 1 unit Increase 2 units Increase 3 units Increase 4 units Intensive Diabetes Management CompensatorySupplements Per Dr. Raskin.
Intensive Diabetes Management Insulin Dose Changes Mealtime Questions • What is my blood glucose now? • Do I plan to eat more or less than usual? • Will I be more or less active after eating? • What has happened under these circumstances previously?
Intensive Diabetes Management Insulin Dose Changes • Adjustments • Based on pattern over several days • ~10% increase or decrease in insulin component preceding BG measurement • Change one component at a time
Intensive Diabetes Management Insulin Timing • Regular insulin usually 30–60 minutes before meals • Rapid-acting analogs taken at mealtime or better yet 15 minutes before • Increase time interval if blood glucose above target (further from meal) • Decrease time interval if blood glucose below target (closer to meal)
Intensive Diabetes Management Meal Size or Carbohydrate Content • Decrease if blood glucose above target or less activity planned • Increase if blood glucose below target or more activity planned
Intensive Diabetes Management Criteria for Selection of Patients • Suboptimal glycemic control • Motivation to pursue intensive therapy • Willing and able to perform frequent SMBG • Sufficient education and ability • Adequate psychological stability • Appropriate financial resources • Skilled medical staff available
Intensive Diabetes Management Contraindications • Hypoglycemia unawareness • Counterregulatory unresponsiveness • Age • Medical reasons, debilitated, short life expectancy, malignancy, etc
Intensive Diabetes Management Benefits of Insulin Pump Therapy • Allows for flexibility in schedule • More physiologic and reproducible • Insulin delivery more predictable • Less hypoglycemia (exercise)
Intensive Diabetes Management Self-Blood Glucose Monitoring Essential Component of Intensive Management
Blood Glucose Monitoring Initially, check blood glucose before and 1.5–2 hours after each meal and at bedtime Weekly at 2:00 AM–3:00 AM Four blood glucose checks before each meal after targets are achieved
Effect of Memory Meter on HbA1c in Patients with Type 1 Diabetes • N = 22 intensively treated T1DM patients (using insulin pump or 4 daily insulin injections) • Monthly mean HbA1c across 12 months • HbA1c 6.9% ± 0.12% before memory meter • HbA1c 6.4% ± 0.10% while a memory meter was used • P = .0004 • Difference in slopes P = .046 • As the frequency of SMBG (tests/day) increased, HbA1c decreased: r = −0.61, P <.01 Strowig SM, Raskin P. Diabetes Care. 1998;21:1694-1698.
Hypoglycemia • Identify hypoglycemia patterns and relate to insulin peaks • Look for causes • — Lifestyle issues • Exercise • Food • Alcohol • — Medical causes • Altered kidney or liver function • Hormonal deficiencies (eg, pituitary or adrenal) • Rapid gastric emptying • Hypoglycemia unawareness National Diabetes Information Clearinghouse (NDIC). Hypoglycemia. Accessed 1/29/13 at: http://diabetes.niddk.nih.gov/dm/pubs/hypoglycemia/#symptoms.
Monitoring • GLYCOHEMOGLOBIN1 • 1–2 MONTHS DURING STABILIZATION • 2–4 MONTHS ROUTINELY • BLOOD PRESSURE—every visit1 • Probably should be measured in both supine and standing positions2 • URINE PROTEIN/MICROALBUMIN—annually1,2 • EYE EXAMS—annually1,2 • FOOT EXAMS—annually1,2 • LIPIDS—annually1,2 1. American Diabetes Association. Diabetes Care. 2012;35(suppl 1):S11-S63. 2. AACE. EndocrPract. 2011;17(suppl 2):1-53.
Adherence to Insulin in Pediatric Type 1 Diabetes • Meta-analysis of 21 studies (N = 2492) • Increased adherence is associated with decreased HbA1c values • Greater association pre-DCCT vs post-DCCT, possibly due to increased complexity of regimens Hood KK, et al. Pediatrics. 2009;124:e1171-e1179.