Download
1 / 63
630 likes | 760 Vues
ZEUS Week DESY, 5/9/2012. Measurement of inelastic J/ y and y (2S) photoproduction at HERA. A. Bertolin , R. Brugnera. Outline: short introduction differential p T 2 cross section in z slices differential z cross section in p T slices y (2S) to J/ y cross sections ratio

E N D
ZEUS Week DESY, 5/9/2012 Measurement of inelastic J/yand y(2S)photoproduction at HERA A. Bertolin, R. Brugnera • Outline: • short introduction • differential pT2cross sectionin z slices • differential z cross section in pTslices • y(2S) to J/y cross sections ratio • momentum flow along the J/y direction • backup slides
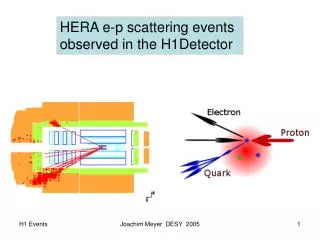
inelastic charmonium production at HERA (J/y and y(2S)) direct g CO model (cc q.n. ¹J/y q.n.) this particular diagram 0.2 < z < 0.9 direct g CS model (cc q.n. = J/y q.n.) 0.2 < z < 0.9 p-rest frame: z =E(y)/E(g*) • other contributions to the signal (decreasing size): • y(2S) ®J/y (®m m) X decays • J/y fromB meson decays • J/y from resolved photon processes • main background sources: • J/y from the elastic g p scattering • J/y from proton diffractive dissociation resolved g CS model z < 0.2
other contributions to the signal • inelastic y(2S) production: • measure it directly using y(2S) ® m m • cannot perform an efficient inclusive reconstruction of the decay y(2S) ® J/y X • y(2S) to J/y cross section ratios will be shown in wide bins of W, z and pT , they are not ideally flat (bins are wide because of the small 2S to 1S cross section ratio) • NOT subtracted (as all other experiments) • charmonium from B meson decays: B production well tested at HERA,much smaller B cross section than at hadron colliders: overall < 2% of the J/y are from B meson decays, < 5 % at low z • NOT subtracted • J/y fromresolvedg processes (including cC® J/y g ): not well know in PHP, LO cross section is tiny at HERA: overall < 0.5 %, < 4 % at low z • NOT subtracted main background sources • elastic and proton diffractive dissociation: why do we have to discard them ? • can not describe elastic and proton diffractive dissociation using calculations based on the exchange of a single hard colored parton • explicit request from the theorists
overall status of the theory • a mess • CS model: • available at LO and NLO (only direct) • more or less ok in PHP, completely wrong in p pbar • NRQCD = CS model + CO model • LO: TERRIBLE … in PHP diverging at low pT and high z, helps in p pbar • NLO direct + resolved: NOW AVAILABLE FOR PHP, will see later on comparison with our data • kTfactorization approach • LO CS model • direct + resolved • high order effects sneaked in via gluon transverse momentum effects • more or less ok in PHP and p pbar • you should NOT be surprised of inconsistencies / hiccups / … in the theory • this is why it is worth to publish our paper • this is known to theorists … see Quarkinium Working Group WEB page and meetings
previous ZEUS papers on the same topic • 1. Measurement of inelastic J/yphotoproduction at HERA • DESY 97-147 (July 1997) • Zeitschrift f. Physik C76 (1997) 4, 599-612 • Alessandro B. PhD thesis + Riccardo B. • 94 data • Measurements of inelastic J/y and y(2S)photoproduction at HERA • DESY-02-163 (September 2002) • Europ. Phys. Journal C 27 (2003) 173-188 • Alessandro B. + Riccardo B. • 96-97 data • Measurement of Inelastic J/y Production in Deep Inelastic Scattering at HERA • DESY-05-071 (May 2005) • European Physical Journal C44 (2005) 13-25 • Alessandro B. + Alexei A. + Igor K. (+ Leonid G. + Riccardo B.) • 96-00 data • Measurement of J/y helicity distributions in inelastic photoproduction at HERA • DESY-09-077 (June 2009) • JHEP12 (2009) 007 • Alessandro B. + Riccardo B. • HERA I + HERA II this is why this paper draft is not written like (1) or (2) … tried not to write the same things again and again …
analysis highlights • full details: • Measurement of J/y helicity distributions in inelastic photoproduction at HERA - JHEP12 (2009) 007 • http://www-zeus.desy.de/~bertolin/ZEUS_ONLY/inelpsidsdzdpt2/index.html • highlights: • data set: HERA I (114.1 pb-1) + HERA II (354.2 pb-1), please keep in mind the better performances of CTD FLT and B/R MUON in HERA I w.r.t HERA II • y reconstruction:y ® m m, at least one m must be tagged in B/R MUON and CAL, the other tagged at least by CAL, |h| < 1.75 (no FMUON), require minimum p/pt to be almost in the plateau region of the R/B MUON detectors … • (inelastic) events selection: E(FCAL) > 1 GeV, at least 3 central (|h| < 1.75) vertex tracks with pt > 250 MeV • elastic contribution removed due to E(FCAL) > 1 GeV • elastic contribution removed due to the requirement of at least 3 central vertex tracks • proton diffractive dissociation strongly suppressed by E(FCAL) > 1 GeV • proton diffractive dissociation strongly suppressed by the requirement of at least 3 central vertex tracks
MC modeling • signal: • using mostly HERWIG MC • beauty + resolved MC samples for specific cross checks: PYTHIA MC • background: • EPSOFT MC • tuning of the HERWIG (pT) and EPSOFT (pT, W, MX) MC based on data: see backup slides
proton diffractive dissociation subtraction EPSOFT MC generated z diffractive events are generated at z » 1 we measure cross sections for z < 0.9 the overlap should be ZERO HOWEVER due to the finite z resolution some of the diffractive events are RECONSTRUCTED with z < 0.9 0.9 • fit the reconstructed z distribution to estimate the amount of diffractive events left after the z < 0.9 cut • for the fit the only change with respect to the nominal analysis is done for the z range: • nominal z range: 0.1 < z < 0.9 • z range used for the diffractive fit: 0.3 < z < 1 • why ? • we remove 0.1 < z < 0.3 because there is no diffractive yield at low z, instead we observe a larger non resonant background and expect contributions also from beauty and may be resolved • we add 0.9 < z < 1 to have more diffractive background and hence more “signal” for the fit
proton diffractive dissociation subtraction data HERWIG MC event fractions / bin EPSOFT MC shape distorted by the E(FCAL) > 1 GeV and ³ 3 (vertex) tracks requirements purpose of the fit: fractions of HERWIG MC and EPSOFT MC that best describe the data
proton diffractive dissociation subtraction data MC sum events fraction / bin HERWIG MC component from the fit outcome: HERWIG MC fraction for z < 0.9 is 94.7 % • data: stat. errors • MC: no uncertainty; sys. errors, due for example to the hadronic energy resolution, with size comparable to the data stat. errors, NOT shown in the above plot • in the range 0.3 < z < 0.9, this fit, the result is: 0.947 • in the nominal analysis z range, 0.1 < z < 0.9, the result is: 0.954 • background is small, overall < 5 %
cross section vs pT2in z slices 0.75 < z < 0.9 0.6 < z < 0.75 • pT2 (and not pT) is the variable always used • “classical” measurement performed by all mature PHP experiments • 60 < W < 240 GeV • W < 60 GeV: too forward, out of acceptance • W > 240 GeV: low event yield, large non resonant background • 1 < pT2< 100 GeV2 • pT2 > 1 GeV2:agreed with the theorists • pT2 < 100 GeV2: low event yield … 0.45 < z < 0.6 0.3 < z < 0.45 Alessandro: black Riccardo: blue
cross section vs pT2in z slices 0.1 < z < 0.3 Alessandro: black Riccardo: blue • two analyses are in very good agreement
cross section vs z in pTslices 60 < W < 240 GeV same as before 0.1 < z < 0.9 same as before 2 < pT< 3 GeV 1 < pT< 2 GeV Alessandro: black Riccardo: blue 0.9 0.9 3 < pT< 4.5 GeV pT> 4.5 GeV • two analyses are in very good agreement 0.9 0.9
2S to 1S cross section ratio basic formulas: with some algebra: PDG2010 ≡ Please use this CITATION: K. Nakamura et al. (Particle Data Group), Journal of Physics G37, 075021 (2010) and 2011 partial update for the 2012 edition. FULL details: http://www-zeus.desy.de/~bertolin/ZEUS_ONLY/zn-03004/node41.html ZEUS Note of the HERA I paper for the HERA I paper we used PDG2002: Data Br1SMu/5.88E-2/,Br2SMu/0.70E-2/,Br2S1S/55.7E-2/ todayPDG2010: Data Br1SMu/5.93E-2/,Br2SMu/0.77E-2/,Br2S1S/59.5E-2/
2S to 1S cross section ratio vs W, z, pT • the phase space is different ! • yes • W < 190 GeV … above no 2S peak, remember that the yield decrease as W increases … • z > 0.55 … below no 2S peak, remember that the yield decrease as z decreases … almost exponentially … • pTgoes to 0 … so we have more statistics, also fine since we have no NLO / kT theory to compare to, the LO CS model only need z < 0.9 • two analyses are in very good agreement
p flow against / along the J/y direction • goal: check if the CS model, as implemented in the LO + PS HERWIG MC, can give a reasonable description of the momentum flow along the J/y direction • reminder: • in the CS model you have only a J/y and a backward “hard” gluon (transverse momentum conservation in PHP) … so along we expect almost nothing … • in the CO Model you have a J/y with some nearby hadronic activity (“soft” gluons) and a backward “hard” gluon … some along activity should be visible … • clearly such an analysis would profit of large J/y pT, like in CMS, but due to the overall status of the theory a qualitative result in PHP would be very valuable anyway (in CMS due to the pT boost the “soft” gluons would become hard ones) • the against momentum flow is studied only “as a cross check”
p flow against / along the J/y direction • only change with respect to the phase space used for the J/y cross section measurements: • 0.3 < z < 0.9 • 0.1 < z < 0.3 removed because of the small event yield, yield decrease as z decreases, and of the large amount of non resonant background observed • vertex tracks • pt(min) > 150 MeV • | h | < 1.75 (HERA I CTD acceptance) • do not consider the m+ and m-tracks • track and J/y same/opposite hemisphere: p projection along the J/y gives a positive contribution to Palong/Pagainst • use hemispheres because everybody suspects that the “soft” gluons will not give well collimated hadrons at HERA • must discard the proton remnants … they have nothing to do with the momentum flow around the J/y direction … so | h | < 1.75 is quite appropriate ! J/y direction of flight in the lab. as discussed with F. Maltoni (UC Louvain, Be) could have used ZUFOs but should have used | h | < 1.75 anyway … so the difference between central ZUFOs and central vertex tracks is not so large … we do not see the neutrals but for soft charged hadrons CTD is better than CAL
p flow against / along the J/y direction • have to measure two distributions: Pagainst and Palong • binning of each distribution: 0. 0.25 0.5 1. 1.5 2. 2.5 3. 4. 5. GeV • have to measure vs pT • pTbins: 1. 1.4 1.9 2.4 3.4 4.2 10. GeV (bins used for the “inelastic J/y helicity paper”) • expect large statistical errors (like in the helicity paper) Alessandro’s and Riccardo’s analyses differ in the way the non resonant background is handled (Alessandro: side bands, Riccardo: mass fit) … see previous HFL presentations for more details … every method has its own advantages and disadvantages … so how does the two methods compare ?
p flow against/along the J/y: data comparison Alessandro: black Riccardo: blue against along • two analyses are in very good agreement for data
Alessandro: black Riccardo: pink p flow against/along the J/y: MC comparison along against along against • two analyses are in very good agreement for MC
sys. error analysis diffractive background subtraction hadronic energy resolution BMUI chambers efficiency RMUI chambers efficiency J/y helicity parameters: l J/y helicity parameters: n HERWIG MC pTspectrum EPSOFT MC MX spectrum EPSOFT MC W spectum EPSOFT MC pT2 spectrum invariant mass fit central vertex track multiplicity cut from 3 to 5 I will show the 12 steps, one by one, for the z differential cross section in pTslices ALL the rest: http://www-zeus.desy.de/~bertolin/ZEUS_ONLY/inelpsidsdzdpt2/ijphp-sys-120518.pptx / .pdf
s vs z for different pT slices: diffractive background • diffractive component quantified by comparing the z(rec.) distribution measured in data with an HERWIG (signal) + EPSOFT (background) MC mixture • increase / decrease the EPSOFT fraction while keeping a reasonable agreement between data and MC mixture • redo all calculations • only one bin, at low pt and high z, with cross section variations > ± 5 %
s vs z for different pTslices: hadronic energy resolution • z = f (E-Pz(J/y),E-Pz(ZUFO)) • using the true J/y kinematic work out the true E-Pz • decrease or increase the difference E-Pz(ZUFO) - E-Pz by 20 % event by event • redo all calculations • variations < ± 5 % • may be 20 % seems “large” but even with this “large” value the results are stable … 20 % is also the value we used in the previous J/y papers • had. energy resolution studies: • jet – jet ET balance in PHP • e’ – hadrons balance in DIS • none of them apply to the J/y case in a recent ZEUS jet paper Inclusive-jet Photoproduction at HERA and determination of Alpha_s, Nucl. Phys. B864 (2012), 1-37 quote ± 1 %
s vs z for different pTslices: BMUI chambers efficiency • efficiency in data computed from two tracks J/y events, known within some statistical uncertainties (due to the finite number of two tracks J/y events) • data efficiency plugged into the MC at the analysis level (eaze) • decrease or increase the efficiency for the barrel section, rear section unchanged • redo all calculations • variations in the range ± 5 %, the size of the stat. uncertainties on the efficiencies
s vs z for different pTslices: RMUI chamber efficiency • efficiency in data computed from two tracks J/y events, known within some statistical uncertainties (due to the finite number of two tracks J/y events) • data efficiency plugged into the MC at the analysis level (eaze) • decrease or increase the efficiency for the rear section, barrel section unchanged • redo all calculations • variations in the range ± 5 %, the size of the stat. uncertainties on the efficiencies, for z > 0.75 • variations much smaller for z < 0.75
s vs z for different pTslices: l helicity parameter • l related to the polar distribution of the m in the J/y rest frame • l = 0: isotropic • l is weekly dependent on z and pt • from the ZEUS measurements (HERA I+II) we know that | l | < 0.5 “everywhere” • l = ± 0.5 at the event level • redo all calculations • largest sys. error of the analysis • unavoidable (even if you go to p p instead of PHP)
s vs z for different pTslices: n helicity parameter • n related to the azimuthal distribution of the m in the J/y rest frame • n = 0: isotropic • n is weekly dependent on z and pt • from the ZEUS measurements (HERA I+II) we know that | n | < 0.5 “everywhere” • n = ± 0.5 at the event level • redo all calculations • largest sys. error of the analysis • unavoidable (even if you go to p p instead of PHP)
s vs z for different pTslices: HERWIG MC pT spectrum • theHERWIGMCJ/y pt spectrum is reweighted to the data • can make the MC spectrum harder or softer while keeping a reasonable agreement between data and MC • additional weight given by exp(a pt2) at the event level • redo all calculations • small effect • as expected based on the experience with the past papers
s vs z for different pTslices: EPSOFT MC Mx spectrum • theEPSOFTMCMx spectrum can be fitted with the function 1/Mx • E(FCAL) is the observable mostly sensitive to the Mx spectrum • can make the MC spectrum harder or softer while keeping a reasonable agreement between data and MC • additional weight given by 1/Mxa at the event level • redo all calculations • small effect • Mx has a small impact on z(rec) i.e. E-Pz in FCAL is small
s vs z for different pTslices: EPSOFT MC W spectrum • theEPSOFTMCWgp spectrum is flat … unphysical … • reweight to a linear dependence: observe good agreement between data and MC for 2 tracks events at high z (diffractive background rich region we cut out in the analysis) • can make the MC spectrum harder or softer while keeping a reasonable agreement between data and MC • additional weight given by Wa at the event level • redo all calculations • small effect • W has a small impact on z(rec) with the kinematic of diffractive events
s vs z for different pTslices: EPSOFT MC pT2 spectrum • theEPSOFTMCpt2 spectrum was set to -1 and -0.5 at the generation level and the two samples added • observe good agreement between data and MC for 2 tracks events at high z (diffractive background rich region we cut out in the analysis) • can make the MC spectrum harder or softer while keeping a reasonable agreement between data and MC • additional weight given by exp(a pt2) at the event level • redo all calculations • small effect • sizable only for z > 0.75 at low pt
s vs z for different pTslices: invariant mass fit • invariant mass procedure is fitting the non resonant background away from the mass peak with a smooth function • an invariant mass window is defined for the signal: [2.85,3.3] • count the events in the window and subtract the integral of the non resonant background function over the signal window • change the window by ± 50 MeV (both in data and MC) • redo all calculations • at most a10 % effect in the low z bins, there the S/B ratio is decreasing with respect to the bins with z > 0.45
s vs z for different pTslices: central vertex track multiplicity cut from 3 to 5 • ask for at least 5 vertex track, with pt > 125 MeV and | h | < 1.75 and DO NOT consider any diffractive background after this • redo the analysis • two bins with 20 % variations: • one at high z – pT • one at low z – 2 < pT < 3 GeV • this is testing the diffractive background procedure but also how well the track multiplicity cut is corrected for via MC • it is remarkable that at high z and low pTthe difference is < 10 %
primary vertex tracks control plot (requested by Olaf, NOT for the paper) (primary) vertex tracks with: pt > 250 MeV | h | < 1.75 crosses: data upper histo.: HERWIG + EPSOFT MC lower histo.: EPSOFT MC
E(FCAL) control plot (requested by Olaf, NOT for the paper) crosses: data upper histo.: HERWIG + EPSOFT MC lower histo.: EPSOFT MC
paper figures: invariant mass plot • a few obvious points: • the paper is not based on just ONE invariant mass fit ! • the next figure alone, the control plots figure, needs 15 different invariant mass fits • fig. 1 is just for illustration purposes, to show the overall behavior of the invariant mass distribution(s) we have • it would be impossible to put in the paper all the invariant mass plots practically used
paper figures: 2S to 1S cross sections ratios LO CS model «prediction»: s µ Gmm / m3 1S: 3096.6 MeV, 5.93 % x 92.9 keV 2S: 3686.0 MeV, 0.77 % x 304 keV can work out the prediction with a pocket calculator … naive expectation of the LO CS model: flat ratios at 0.25(2) most of the central values are above 0.25, mild indications that the W - z ratio may not be that flat …
observation on cross sections • proton diffractive dissociation background is subtracted, this is fundamental for the theorists; • y(2S) feed down is not subtracted, an inclusive reconstruction of the y(2S) decay would be needed and we do not have it. But the 2S to 1S cross section ratios vs pt W and z are measured. Theorists (should) know how to correct for this. Moreover they never asked us to perform this subtraction; • J/y from any B hadron decay are not subtracted: • the ratio between B hadron to J/y to “primary” J/y is much smaller at HERA than at hadron colliders (CDF, D0, CMS, ATLAS) • theorists never asked us to perform this subtraction • no PHP experiment up to now has performed this subtraction • a subtraction based on data is very hard • the only subtraction we could do would be fully based on MC … likely the theorists could account for this better than us (by adding a beauty component to the QCD predictions) • we quantify the size of this contribution • the cross section we quote, the number in nb, is corrected for this effect, as explained in the following slides
J/y from b decay: effect of the quoted number of nb • for cross section vs pt2 in z slices • for every Dpt2 bin: • disregarding any difference in the correction factors (= acceptances) for beauty: • s = N / CH L f.f. BR Dpt2 = s0 • taking explicitly the beauty correction factor (= acceptance) into account: • s = N – Nb / CH L f.f. BR Dpt2 + Nb / Cb L f.f. BR Dpt2 • … • = s0 [1+(Nb/N)(CH-Cb)/Cb] • outcome: • if Nb/N << 1 s = s0 • if CH=Cb s = s0
J/y from b decay: effect of the quoted number of nb expected number of J/y from b decay (Pythia PHP inclusive beauty sample): continuous: 0.1 < z < 0.3 dashed: 0.3 < z < 0.45 dotted: 0.45 < z < 0.6 z > 0.6: at the event level negligible usually < 10 events, 16 at most (low z low pt) when Nb is largest Nb/N < 16/375 < 0.045 usually Nb/N < 10/400 < 0.025 total number of beauty MC events processed: 22.207.433
J/y from b decay: effect of the quoted number of nb • 0.1 < z < 0.3: • s = s0 [1+(Nb/N)(CH-Cb)/Cb] • =s0 [1+0.25×(Nb/N)] • <s0 [1+ 0.25×0.045] (use largest Nb/N) • < s0[1+ 1.2 %] negligible cross section increase (stat. error is > 10 % level) • 0.3 < z < 0.45: • CH = Cb s = s0 whatever amount of beauty we have in data the number in nb we quote for the cross section is correct • for z > 0.45 Nb/N is so small that the effect is negligible anyway
J/y from b decay: effect of the quoted number of nb outcome on beauty: beauty is included in the cross sections and the quoted cross sections, the number of nb, take this contribution properly into account any theorist can compute the J/y cross section, according to his preferred model, compute the J/y from beauty contribution, according to his preferred model, add the two numbers and compare with our data … as requested, we added to the paper tables “our” beauty cross numbers, obtained from the Pythia MC …
paper figures: momentum flow along and against the J/y direction although this is NOT a cross section measurement try to use a graphical layout similar to fig. 4 to 7, as requested
conclusions and outlook the material for the paper has been presented … we have the feeling this is the best we can do keeping in mind the different constraints we have (we are not leaving in a word with an infinite amount of money and time)
s vs pT2 in z slices and s vs z in pT slices • theorists “like” and requested explicitly the s vs z because z is believed to be the key variable in PHP • they “like” and requested explicitly s vs z with pT > (as large as possible) GeV • as a consequence in: • Measurements of inelastic J/y and y(2S) photoproduction at HERA • Europ. Phys. Journal C 27 (2003) 173-188 • we provided: • s vs z with pT> 1 GeV • s vs z with pT> 2 GeV • using s vs pT2 in z slices one can build the s vs z with pT> something … summing the contributions of the appropriate bins … • but then for the stat. errors ? • do we advise to take the square root of the sum of the squares of the stat. errors of the appropriate bins ? • but then for the syst. errors ? • so let’s provide the theorist directly with what they need: • s vs z with pT > 4.5 GeV • and add: • s vs z with 1 < pT < 2 GeV • s vs z with 2 < pT < 3 GeV • s vs z with 3 < pT < 4.5 GeV • to allow also comparisons between the different ranges