Download
1 / 48
530 likes | 936 Vues
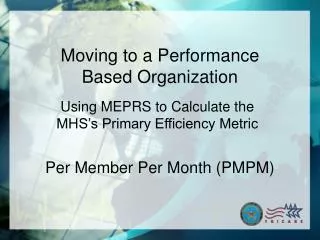
Per Member Per Month (PMPM). Moving to a Performance Based Organization. Using MEPRS to Calculate the MHS’s Primary Efficiency Metric. Purpose of Briefing. Provide information on calculation and drivers of MHS’s primary efficiency metric Medical Cost per Prime Equivalent Life

E N D
Per Member Per Month (PMPM) Moving to a Performance Based Organization Using MEPRS to Calculate the MHS’s Primary Efficiency Metric
Purpose of Briefing • Provide information on calculation and drivers of MHS’s primary efficiency metric • Medical Cost per Prime Equivalent Life • Also known as PMPM/PMPY (per member per month/year) • Explain metric • Define PMPM/PMPY • Understand some common pitfalls when first reviewing metric • Understand how metric is calculated • Dissect drivers of yearly increase from FY04 to FY05
MHS Mission: To enhance DoD and our Nation’s security by providing health support for the full range of military operations and sustaining the health of all those entrusted to our care. Stakeholder Perspective Financial Perspective S2 Death, injuries and diseases are reduced, function is restored, and performance is enhanced during and after military operations S1 Forces are medically ready to deploy, their performance is enhanced through medical interventions, and both the force and communities are protected from medical threats S4 The MHS creates healthy communities S3 Beneficiaries are satisfied with their health care F1 DoD Health Care Costs are managed; Benefit is sustained and shaped Customer Perspective Commanders and Service Members DoD Beneficiaries “Product Leadership” “Total Customer Solution” C4 “The MHS supports me in achieving individual medical readiness and enhancing performance.” C1 “I am a partner with my healthcare team. We know and care about improving my health.” C2 “It feels like the Military Health System was designed just for me.” C3 “I have responsive, capable & coordinated medical services anywhere, anytime.” Internal Process Perspective Mission Centered Care Patient Centered Care Medically Ready and Protected Force and Homeland Defense for Communities Manage and Deliver the Health Benefit Deployable Medical Capability IP7 DoD homeland defenses, civil support and military medical operations, are effectively supported IP5 Joint, interoperable, and interdependent processes effectively deliver care anytime, anywhere IP2 Beneficiaries partner with us to improve health outcomes IP10 Individual Medical Readiness is assessed and managed to improve health and enhance performance IP3 Our health care processes are patient centered, safe, effective and efficient IP8 New products, processes and services are rapidly developed and deployed to support the mission – “Bench to Battlefield” IP1 Evidence based medicine is used to improve quality, safety and appropriate utilization of services IP9 Continuous, efficient health status monitoring focuses health improvement activities IP6 Comprehensive globally accessible health and business information enables medical surveillance, evidence based medicine and effective health care operations Learning & Growth Perspective Organization & Culture Human Capital Science and Technology L3 Culture of jointness and interagency cooperation L1 Employees create success for customers L6 DoD Biomedical R&D is coordinated and focused on militarily relevant issues L5 Personnel are recruited, trained, educated, and retained to meet requirements L7 IM/IT is leveraged to enhance capabilities L2 The MHS embodies performance based management and a culture of innovation focused on results L4 Authority and accountability are aligned throughout MHS Resource Perspective R1 Resources are predictably available, aligned, and transparent R2 Infrastructure is maintained and improved to optimize performance
What is PMPM/PMPY? • The accumulated medical costs associated with enrollees by enrollment site each month • Inpatient, Outpatient, Pharmacy, Ancillary • Wherever DHP care is received • Direct Care, Purchased Care, TRICARE Mail Order Pharmacy • Direct Care costs calculated at MTF where care is delivered but assigned to enrollment site • Divide total cost by number of enrollees adjusted for age/gender/beneficiary category • Reflects differences in underlying demographics • Done on a per person basis, not total volume • Only reflects cost for enrolled individuals
Things to keep in mind • PMPM metric is looking from an insurance point of view • We both manage enrollee utilization like an insurance company and produce care • So we have Enrollee Unit costs, and MTF Production Unit Costs • Enrollee cost are based on care provided in any locale • Enrollee Direct Care Unit cost is not for your facility alone • MTF Production costs are allocated to enrollees basedon their proportion of care • MTF Production Unit costs are based on all care produced, and applied to enrollees based on amount used • Enrollee utilization reduction does not automatically mean that MTF Production Unit costs will increase • Since MTF Production unit cost is based on all care, unit costs only rise if MTF overall production decreases
How PMPM is built • Direct Care cost information is based on cost allocation algorithms • MTF Production Inpatient Unit Cost • Inpatient Cost per RWP • MTF Production Outpatient Unit Cost • Outpatient Cost per APG • Purchased Care based on claims data • Pharmacy costs are based on PDTS • Enrollee Equivalent Lives are based on DEERS adjusted for Age/Gender/Bencat
MTF Production Inpatient Unit Cost(Inpatient Cost per RWP) • Cost of producing one weighted unit of care at each MTF • RWP is common weighted unit for MHS • Based on all care produced at MTF • This includes Active Duty, Prime, Standard, Tricare for Life • Total RWPs are summed for all categories of care • Expense data is from MEPRS • Inpatient is based on MEPRS A codes with step downs • Depreciation costs are then removed • Labor expense is based only on current month • All other expenses are based on Rolling 12 month • Total Expenses are divided by RWPs to get • MTF Production Inpatient Unit Cost
MTF Production Outpatient Unit Cost(Outpatient Cost per APG) • Cost of producing one weighted unit of care • APG is used to associate Ancillary with encounter • Based on all care produced at MTF • This includes Active Duty, Prime, Standard, Tricare for Life • Total APGs are summed for all categories of care • Expense data is from MEPRS • Inpatient is based on MEPRS B codes with step downs • Depreciation costs and pharmacy are then removed • Labor expense is based only on current month • All other expenses are based on Rolling 12 month • Total Expenses are divided by APGs to get • MTF Production Outpatient Unit Cost
~ ~ MTF Production Unit Cost TFL Standard 44 RWPs 17 RWPs Prime 87 RWPs MEPRS “A” $1,324K / = $8,946/RWP 148 RWPs 148 RWPs $9K/RWP
TFL Standard 44 RWPs 17 RWPs Utilization Prime 87 RWPs
MTF Production Unit Cost: $12K/RWP Utilization: 134 RWPs MTF Production Unit Cost: $10K/RWP Utilization: 62 RWPs Total Cost: $620K Total Cost: $1,608K Total Cost: $783K Total Cost for Enrollee Care $620K $1,608K $970K $783K $3,981K DACH Enrollee Inpatient Care WRAMC Purchased Care NNMC Claims Cost: $970K Dewitt ACH MTF Production Unit Cost: $9K/RWP Utilization: 87 RWPs
Equivalent Lives • Developed to adjust for health utilization differences across populations • Age/Gender/Beneficiary Category adjustors • By adjusting enrolled population, comparisons can be made across MTFs and Services • While this is an overall adjustment, it may not be appropriate for just one component of PMPM • (i.e. Inpatient/Outpatient/Pharmacy)
Enrollees vs. Equivalent Lives 1.00 1.00 1.00 1.00 1.00 1.00 1.00 1.00 1.00 1.00 1.00 1.00 1.00 1.00 1.00 1.00 1.00 1.00 1.00 1.00 WRAMC Fort Benning 10 Lives 10 Lives If enrollees all received the same type and amount of care they would all be average (1.00 EqLvs)
U.S. ARMY COOK COOK COOK COOK COOK COOK U.S. ARMY U.S. ARMY U.S. ARMY U.S. ARMY U.S. ARMY 14.79 EqLvs 8.67 EqLvs 10 Lives 10 Lives Enrollees vs. Equivalent Lives 2.00 1.60 1.38 .890 .855 1.49 .902 .890 .471 1.12 1.60 .652 3.45 .562 .652 .635 .600 2.96 .374 .374 WRAMC Fort Benning
Drivers of PMPM • Utilization of Services • Average Cost of Services • Enrollee Direct Care Unit Cost • Enrollee Purchased Care Unit Cost • Direct/Purchased Care Market Share
Analysis • How much of total increase is driven by each factor • Contribution by driver is a function of the increase in driver and contribution toward total PMPM • For example, a driver that had a large increase but was only a small percentage of PMPM may not contribute much to overall increase
2,881 2,760 2,736 2,698 2,641 2,567 2,498 2,493 2,466 2,373 2,356 2,405 2,300 2,292 2,059 Army Navy MCSC Air Force MHS FY04/05/06 Prime Enrollee PMPY Comparison PMPY increased 8.2% from FY05 to FY06 9.1% for Army (9.1%) Navy (7.5%) AF (9.5%) MCSC (7.6%)
+240 +238 +232 +236 +193 +205 +195 +193 +174 +142 Army Navy MCSC Air Force MHS FY04/05/06 Prime Enrollee PMPY Cost Increases by Care Categories • For FY05/06 Increases: • Inpatient costs account for 18% of the total PMPY increase • Outpatient costs account for 64% of total PMPY increase • Pharmacy cost increases account for 18% of total PMPY increase
FY05/06 Prime Enrollee PMPY Cost Increasesby Utilization and Average Unit Cost Utilization increases account for 59% of the total PMPY increase.
Average Unit Cost Increases • Three factors • Direct care unit costs • Purchased care unit costs • Plus TMOP for pharmacy • Market share shifts
Inpatient Outpatient Pharmacy MHS Prime Enrollee PMPY Increase Factors • Direct Care average unit cost increase account for 29% of total PMPY increase • Purchased Care average unit cost increases account for 13% of total PMPY increase • Market Share accounts for -1% of total PMPY increase
Prime EnrollmentService Observations • Army • Significant increased outpatient utilization and direct care unit costs (65% of total change) • Shifting of workload to purchased care • Navy • Increased outpatient utilization and direct care unit costs (77% of total change) • Air Force • Increased overall utilization (73% of total change) • MCSC • Large increase in outpatient utilization (39% of total change) • Less care in MTFs for enrollees
Army Navy Pharmacy Inpatient Outpatient Outpatient Pharmacy Inpatient Air Force MCSC Pharmacy Outpatient Inpatient Pharmacy Inpatient Outpatient Service Prime Enrollee PMPY Factors
Summary • Utilization increased for all sectors • Inpatient/outpatient/pharmacy • 59% of total change • Direct Market share declined • 39% to 36% for inpatient • 50% to 47% for outpatient • 74% to 70% for pharmacy • Drivers significantly different across enrollment service • Most likely different by enrollment site
Hypothesized Cause Effect Relationships for Managing the Cost of Delivering the Healthcare Stakeholder Perspective Financial Perspective S2 Death, injuries and diseases are reduced, function is restored, and performance is enhanced during and after military operations S4 The MHS creates healthy communities S3 Beneficiaries are satisfied with their health care S1 Forces are medically ready to deploy, their performance is enhanced through medical interventions, and both the force and communities are protected from medical threats F1 DoD Health Care Costs are managed; Benefit is sustained and shaped Customer Perspective DoD Beneficiaries Commanders and Service Members PMPM “Total Customer Solution” “Product Leadership” C1 “I am a partner with my healthcare team. We know and care about improving my health.” C2 “It feels like the Military Health System was designed just for me.” RVU/Beneficiary RWP/Beneficiary Rx/Beneficiary Internal Process Perspective Mission Centered Care Patient Centered Care Manage and Deliver the Health Benefit Medically Ready and Protected Force and Homeland Defense for Communities Cost/RVU Cost/RWP Cost/Rx Deployable Medical Capability IP3 Our health care processes are patient centered, safe, effective and efficient IP2 Beneficiaries partner with us to improve health outcomes IP1 Evidence based medicine is used to improve quality, safety and appropriate utilization of services IP6 Comprehensive globally accessible health and business information enables medical surveillance, evidence based medicine and effective health care operations Learning & Growth Perspective Organization & Culture Human Capital Science and Technology L1 Employees create success for customers L3 Culture of jointness and interagency cooperation L5 Personnel are recruited, trained, educated, and retained to meet requirements L6 DoD Biomedical R&D is coordinated and focused on militarily relevant issues L7 IM/IT is leveraged to enhance capabilities L2 The MHS embodies performance based management and a culture of innovation focused on results L4 Authority and accountability are aligned throughout MHS Resource Perspective R2 Infrastructure is maintained and improved to optimize performance R1 Resources are predictably available, aligned, and transparent
Issue: Ages that didn’t work with DMIS Age Groups • Age 0-4 • Break into two Groups 0-1 2-4 • Female ADFM/Other 13-18 • Developed Linear Estimate • Other Male 24-38/Female 24-29 • Medical disabled Active Duty • Developed Linear Estimate • All Groups 35-44 • Developed Linear Estimate • All Groups 45-64 • Used Other Category to develop slope • Linear Estimate based on value at Age 45 Plus Slope
Eq Lives Factors Note: Age 45+ are based on single slope for Male/Female. Only adjustment for Beneficiary category is at starting point.
Average Unit Cost Increases • Three Factors • Direct Care Unit Costs • Purchased Care Unit Costs • Plus TMOP for Pharmacy • Market Share Shifts
MHS Prime Enrollee PMPY Increase Factors Inpatient Outpatient Pharmacy • Direct Care average Enrollee unit cost increase account for 31% of total PMPY increase • Purchased Care average Enrollee unit cost increases account for 28% of total PMPY increase • Market Share accounts for -13% of total PMPY increase
Prime Enrollment Service Observations • Army • Significant increased Enrollee Unit Cost for outpatient (42% of Total Change) • Shifting of workload to purchased care • Navy • Increased direct care inpatient Utilization and Enrollee Unit Costs (41% of Total Change) • Air Force • Shift to purchased care in all areas • Most utilization management • MCSC • Large increase in Outpatient Utilization (36% of Total Change) • Less direct care across all areas
Service Prime Enrollee PMPY Factors Army Navy Pharmacy Outpatient Inpatient Pharmacy Inpatient Outpatient Air Force MCSC Pharmacy Inpatient Outpatient Pharmacy Outpatient Inpatient
FY04/05 Prime Enrollee PMPY Cost Increases by Utilization and Average Enrollee Unit Cost Active Duty MHS AD Family Retiree & Family • Utilization increases account for 49% of the total PMPY increase • Active Duty 53% of total • AD Family 50% of total • Retiree and Family 38% of total
Prime Enrollment Beneficiary Observations • Active Duty • Increases in Utilization 53% of Increase • Majority focused on Inpatient 26% and Outpatient 23% • Direct Care Unit cost 45% of increase • Outpatient cost 34% • Active Duty Family • Outpatient Utilization 31% of Increase • Shift to purchased care in all area • Retiree and Family • Outpatient Utilization 36% and Rx Costs 33% largest drivers • Shift to purchased care in all areas • Most utilization management
Summary • Utilization increased for all sectors • Inpatient/Outpatient/Pharmacy • 49% of Total Change • Direct Market Share declined • 44% to 41% for inpatient • 51% to 46% for outpatient • 75% to 69% for Pharmacy • Drivers different across beneficiary category • Outpatient utilization up across all
Inpatient Prime Enrollee Information FY04/05 Change +7% FY04/05 Change +6% +8% +7% +5% +6% +6% +11% +5% +5% DC Mkt 42% 40% 7% 7% 43% 40% 60% 63% 65% 64% MHS Army Navy Air Force MCSC MHS Army Navy Air Force MCSC FY04/05 Change +5% +6% +9% +6% +5% FY04/05 Change +8% +6% +12% +6% +11% MHS Army Navy Air Force MCSC MHS Army Navy Air Force MCSC
Outpatient Prime Enrollee Information FY04/05 Change +4% FY04/05 Change +1% +1% +3% +3% +8% +7% +1% +1% +3% DC Mkt 51% 46% 6% 4% MHS Army Navy Air Force MCSC 59% 55% 70% 68% 74% 71% MHS Army Navy Air Force MCSC FY04/05 Change +5% +5% +7% +7% +4% FY04/05 Change +4% +9% +1% +1% +8% MHS Army Navy Air Force MCSC MHS Army Navy Air Force MCSC
FY04/05 Change +4% Pharmacy Prime Enrollee Information FY04/05 Change +8% +5% +5% +2% +3% +9% +5% +3% +10% DC Mkt 75% 69% 87% 82% 92% 89% 91% 88% 20% 17% MHS Army Navy Air Force MCSC MHS Army Navy Air Force MCSC FY04/05 Change +6% FY04/05 Change +3% +7% +5% +5% +7% -1% +5% +4% +4% MHS Army Navy Air Force MCSC MHS Army Navy Air Force MCSC FY04/05 Change +8% +48% -1% -4% +4% MHS Army Navy Air Force MCSC
FY04/05 Care Utilization and Unit Cost Driving Prime Enrollee PMPY Cost Increases
FinancialMedical Cost per Prime Equivalent Life % Change from Prior Year The Goal is to stay below a 11% increase. 11% is the projected increase for Private Sector Health Care premium increases Note: Enrollees are adjustedfor age/gender
Medical Cost per Prime Equivalent Life Percent of Total by Care Category