
Evidence of Transport Processes in Carbon Monoxide Data from MOPITT 2004
Discussing MOPITT data validation, CO profiles, and transport events observed, with case studies of deep convection and stratosphere-troposphere exchange. Details zonal mean global CO distribution.

Evidence of Transport Processes in Carbon Monoxide Data from MOPITT 2004
E N D
Presentation Transcript
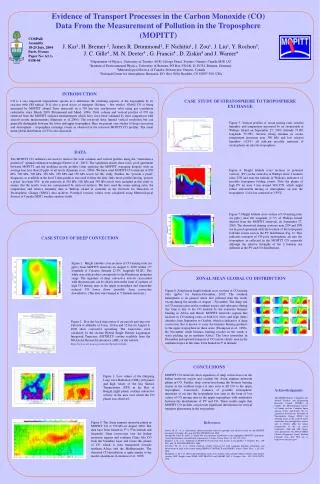
Evidence of Transport Processes in the Carbon Monoxide (CO) Data From the Measurement of Pollution in the Troposphere (MOPITT) COSPAR Assembly 18-25 July, 2004 Paris, France Paper No: A1.1-0158-04 J. Kar1, H. Bremer 2, James R. Drummond1, F. Nichitiu1, J. Zou1, J. Liu1, Y. Rochon3, J. C. Gille4 , M. N. Deeter4 , G. Francis4 , D. Ziskin4 and J. Warner4 1Department of Physics, University of Toronto, 60 St. George Street, Toronto, Ontario, Canada M5S 1A7 2Institute of Environmental Physics, University of Bremen, PO Box 330440, D-28334, Bremen, Germany 3Meteorological Service of Canada, Downsview, Ontario, Canada 4National Center for Atmospheric Research, P.O. Box 3000, Boulder, CO 80307-300, USA INTRODUCTION CASE STUDY OF STRATOSPHERE TO TROPOSPHERE EXCHANGE CO is a very important tropospheric species as it influences the oxidizing capacity of the troposphere by its reaction with OH radical. It is also a good tracer of transport (lifetime ~ few weeks). Global CO is being measured by MOPITT aboard Terra spacecraft in a 705 km sun synchronous orbit using gas correlation radiometry since March 2000 (Drummond and Mand, 1996). Total column and vertical profiles of CO are retrieved from the MOPITT radiance measurements which have since been validated by inter comparison with aircraft in-situ measurements (Emmons et al.,2004). The retrievals have limited vertical resolution but can generally distinguish between the lower and upper troposphere. Here we present case studies of deep convection and stratosphere – troposphere exchange events as observed in the retrieved MOPITT CO profiles. The zonal mean global distribution of CO is also discussed. Figure 5. Vertical profiles of ozone mixing ratio, relative humidity and temperature measured by an ozonesonde at Wallops Island on September 27, 2000 (latitude 37.8N, longitude 75.5W). Several strong laminae in ozone, temperature inversion near 300 hPa and low relative humidity (<25%) all indicate possible intrusion of stratospheric air into the troposphere. DATA The MOPITT CO radiances are used to retrieve the total columns and vertical profiles using the “maximum a posteriori” optimal estimation technique (Deeter et al., 2003). The validation results show fairly good agreement between MOPITT and the modified in-situ profiles (after applying the MOPITT averaging kernels) with an average bias less than 20 ppbv at all levels (Emmons et al., 2004). We have used MOPITT CO retrievals at 850 hPa, 700 hPa, 500 hPa, 350 hPa, 250 hPa and 150 hPa levels for this study. Further, the ‘percent a priori’ diagnostic as available in the level 2 data products was used to filter the data. Only those profiles having ‘percent a priori’ less than 50% in the retrievals at 700 hPa, 500 hPa and 350 hPa levels were included in this study to ensure that the results were not contaminated by retrieval artifacts. We have used the ozone mixing ratio, the temperature and relative humidity data at Wallops island as available in the Network for Detection of Stratospheric Change (NDSC) data archives. Potential vorticity values were calculated using Meteorological Service of Canada (MSC) weather analysis fields. Figure 6. Height latitude cross sections of potential vorticity (PV) on the same day at Wallops show 2 features (near 25N and near the latitude of Wallops) indicative of possible tropopause folding events. Note the plume of high PV air near 3 km around 34N-35N, which might reflect irreversible mixing of stratospheric air into the troposphere. Color bar saturated at 3 PVU. Figure 7. Height latitude cross section of CO mixing ratio (in ppbv) near the longitude ( 5o) of Wallops Island derived from the MOPITT retrievals on September 27, 2000. The downward sloping contours near 25N and 38N are in good agreement with the location of the tropopause fold like events seen in the PV distribution (Fig. 6). This indicates transport of CO-poor stratospheric air into the troposphere as reflected in the MOPITT CO retrievals although the relative strengths of the 2 features are different in the PV and CO distributions. CASE STUDY OF DEEP CONVECTION Figure 1. Height latitude cross sections of CO mixing ratio (in ppbv) from MOPITT retrievals on August 6, 2000 within ±5o longitude of Calcutta (latitude 22.3N, longitude 88.2E). The white area with no data corresponds to the Himalayan mountain range. The signature of deep convective activity (associated with the monsoon) can be clearly seen in the form of a plume of high CO mixing ratio in the upper troposphere and somewhat reduced CO lower down (possibly from convective downdrafts). (The data were binned at 5o latitude intervals.) ZONAL MEAN GLOBAL CO DISTRIBUTION Figure 8. Zonal mean height latitude cross sections of CO mixing ratio (ppbv) for January-December, 2002. The southern hemisphere is in general much less polluted than the north, except during the months of August – November. The sharp rise in CO mixing ratios in the southern tropics and subtropics during this time is due to the CO emitted by the extensive biomass burning in Africa and Brazil. MOPITT retrievals capture this increase in CO mixing ratios at both low (first) and high (later) altitudes from September to October, which is indicative of deep convection that is known to carry the biomass burning products to the upper troposphere in these areas (Thompson et al., 1996). By November while biomass burning recedes in the south, it starts picking up in northern Africa. The latter intensifies in December and upward transport of CO can be clearly seen in the northern tropics at this time. Data binned in 5o in latitude. Figure 2. Five day back trajectories of air parcels arriving over Calcutta at altitudes of 8 km, 10 km and 12 km on August 6, 2000 show convective upwelling. The trajectories were calculated by the on-line Hybrid Single Particle Lagrangian Integrated Trajectory (HYSPLIT) routine available from the NOAA Air Research Laboratory (ARL) at the website : http://www.arl.noaa.gov/ready/hysplit4.html. CONCLUSIONS MOPITT CO retrievals show signatures of deep convection over the Indian monsoon region and confirm the Asian summer monsoon plume in CO. Further, deep convection during the biomass burning season in the southern tropics is also seen to lift CO to the upper troposphere. Conversely, evidence of possible stratospheric intrusions of air into the troposphere was seen in the form of low values of CO mixing ratio in the upper troposphere with similarities between the distributions of PV and CO. These results imply that MOPITT CO profiles can provide significant information on vertical transport phenomena in the troposphere. Figure 3. Low values of the Outgoing Long wave Radiation (OLR) (left panel) and high values of the Sea Surface Temperatures (SST) in the Bay of Bengal (right panel) confirm convective activity in the area over which the CO plume was observed. Acknowledgments The MOPITT project is funded by the Natural Sciences and Engineering Research Council (NSERC) of Canada, the Meteorological Service of Canada and the Canadian Space Agency (CSA) and NASA. We are grateful to Network for Detection of Stratospheric Change (NDSC) for allowing access to the archived ozone sonde data base through their website and to NOAA ARL for online computation of the air parcel trajectories. OLR and SST images were provided by the NOAA-CIRES Climate Diagnostics Center, Boulder Colorado from their Web site at http://www.cdc.noaa.gov/". Figure 4. The Asian summer monsoon plume in MOPITT CO at 350 hPa in August 2000. The data have been binned in 50 x 50 in latitude and longitude. Deep convection over the Indian monsoon regions and southern China lifts CO from the boundary layer and forms this plume of CO which is then transported towards northern Africa and the Mediterranean. The observed CO distribution is quite similar to the model calculations (Lawrence et al., 2003). References Deeter, M. N. et al., Operational carbon monoxide retrieval algorithm and selected results for the MOPITT instrument, J.Geophys.Res.,doi:10.1029/ 2002JD003186, 2003. Drummond, James R. and G. S. Mand, The measurements of pollution in the troposphere (MOPITT) instrument: Overall performance and calibration requirements, J.Atmos, Ocean. Tech., 13, 314-320, 1996. Emmons, L. K., et al., Validation of MOPITT CO retrievals with aircraft in situ profiles, J. Geophys. Res., 109 (D3), doi: 10.1029/2003JD004101, 2004. Lawrence, M. G., et al., Global chemical weather forecasts for field campaign planning: predictions and observations of large scale features during MINOS, CONTRACE and INDOEX, Atmos. Chem. Phys, 3, 267-289, 2003. Thompson, A. M. et al., Where did tropospheric ozone over southern Africa and the tropical Atlantic come from in October 1992? Insights from TOMS, GTE TRACE A and SAFARI 1992, J. Geophys. Res., 101, 24251-24278, 1996.


