Download
1 / 25
250 likes | 363 Vues
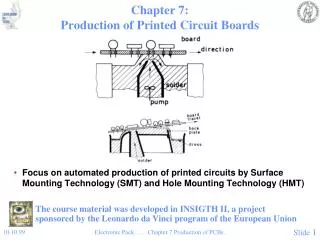
DESIGN OF A RATING SYSTEM FOR SUPPLIERS OF PRINTED WIRING BOARDS AT HAMILTON SUNDSTRAND. By: Travis Bossidy, IE And Patrick Dabrowski, IE Industrial Advisor: Steve Webster Faculty Advisor: Dr. Abdul Kamal. Introduction.

E N D
DESIGN OF A RATING SYSTEM FOR SUPPLIERS OF PRINTED WIRING BOARDS AT HAMILTON SUNDSTRAND By: Travis Bossidy, IE And Patrick Dabrowski, IE Industrial Advisor: Steve Webster Faculty Advisor: Dr. Abdul Kamal
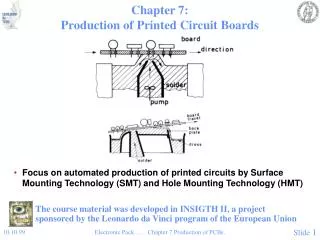
Introduction • Needs to improve the way they rate supplier quality for printed wiring boards (PWB). • Current system uses PPM • Problem: system only takes into account number of defective parts • Other aspects of quality have to be considered
Problem Statement A supplier quality rating system that rates all aspects of supplier quality in order to monitor and compare suppliers of PWB
Components of Supplier Quality • PPM • Complexity • Criticality • PAIN
PPM • Number of Parts Per Million defective • (Quantity Defective/Throughput)*106 = PPM • Only takes into account quantity of defective parts
Complexity • All PWB differ • Simpler parts are easier to make according to specs • Suppliers need to be rewarded for making complex parts
Criticality • Defects differ in how they affect the part • Some defects are not as serious as others
PAIN • Where in the process the defect is located • Further along in the process, the more value added • Hamilton Sundstrand's “Rule of Ten”
Rating System • All four components will be placed into an equation • The value will be in adjusted PPM (PPMNEW) • The PPMNEW can be higher or lower than the original PPM
The Equation • The original PPM equation will be used • Each additional component will be represented by a factor • The output of the equation will be PPMNEW • Median values for each component will be needed
Component Factors • Complexity • Scale of 1-4 • 4 being the most complex • Factor determined from sum of 11 different complexity characteristics • Median value is 2.5, linear relationship • Limits for this scale created by histogram method using Tyco's complexity data
Component Factors (continued) • Complexity histogram • TYCO had their PWB summed and rated • Hamilton Sundstrand only wanted 11 of the 21 characteristics included. • Sum was recalculated, were redistributed in the scale attempting to mirror the same percentages
Component Factors (continued) • Criticality • Scale 1-10 • 10 being the most critical defect • If there is more than 1 defect, then the highest value is used • All possible defects were recorded and factor were given • Median value is 5.5, linear relationship
Component Factors (continued) • PAIN • Each step in the process was assigned a value from 10-1000 • 10 being receiving inspection, 1000 being field failure • Steps had to be assigned numeric values
Component Factors (continued) • PAIN (continued) • Graph was created with numeric steps and Pain • Then an equation was determined using a trend line w = 1.155e2.1692 X Where: w = PAIN associated with step x = Numeric value of step in the process
Component Factors (continued) w = 1.155e2.1692 X Where: w = PAIN associated with step x = Numeric value of step in the process
Component Factors (continued) • PAIN (continued) • Equation had to be normalized • Divided by a factor of 10 • This put it on a 1-10 scale • Except for field failure-100
Component Factors (continued) • PAIN (continued) • Median value was found through integrating curve • From the area under the curve, the median PAIN and where it occurs in the process was found by locating the 50% point of the area • Median PAIN was 528 at numeric step number 2.67.
Determining Equation D*(.0189 (.155e2.1692 X )*(0.4)y)*(0.182(z)) ____________________________________ *106 = PPMNEW T Where: D= # of parts found defective x= factor corresponding with step where defect is found y= factor corresponding with how complex each board is z= factor corresponding with how critical each defect is T=Throughput
Final Equation D*( .0029e2.1692 X )*( 0.4 y )*( 0.182 z ) ___________________________________ *106 = PPMNEW T
DATA cube • Once equation was finalized , will be put into a data cube • The data cube has all of TYCO’s quality information needed to produce PPMNEW. • The PPMNEW would be compared to PPM to determine overall impression of TYCO to validate equation
Future of Project • Once the equation is ran through Data Cube, the equation can be validated • Then it can be applied to all of PWB suppliers • Moving Average will monitor suppliers • Corrective Action can be taken
ABET Concerns • Economic Concerns • Ethical Concerns • Social Concerns • Political Concerns • Sustainability