Download
1 / 1
10 likes | 108 Vues
Explore the impact of in-person versus phone interviews with showcard use on data quality in mixed-mode longitudinal surveys. Analyze differences in responses and unintended consequences to improve data comparability. Investigate effects of showcards on respondent burden and data collected. Draw from previous research on interview modes for insights.

E N D
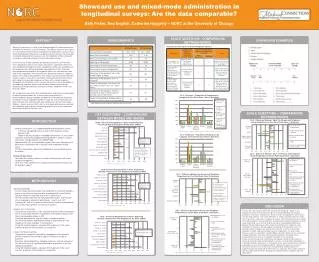
Showcard use and mixed-mode administration in longitudinal surveys: Are the data comparable? Beth Fisher, Ned English, Catherine Haggerty – NORC at the University of Chicago SHOWCARD EXAMPLES ABSTRACT DEMOGRAPHICS SCALE QUESTIONS - COMPARISONS BETWEEN MODES Making Connections is a study of ten disadvantaged US urban communities, funded by the Annie E. Casey Foundation. This poster examines one aspect of survey administration that has implications for longitudinal surveys using a mixed-mode design: differences in responses given in person with the aid of showcards compared to those given over the telephone without showcard use and the substantive impact of multi-mode administration. In the first wave of data collection for Making Connections, all interviews were completed in person. Due to cost constraints, subsequent interviews were completed by telephone when a telephone number was available and the respondent was willing to participate by telephone. When interviews were conducted by telephone, all response options for each question were read to the respondent. If the interview was completed in person, response options were read and respondents were shown a card that enumerated the response options. Questions selected for showcard facilitation were those with a long list of possible responses or those with a scaled response. Showcards are frequently used in surveys because they ease the burden of remembering response options and therefore improve data quality by reducing satisficing or primacy and recency effects (Holbrook, Green, and Krosnick, 2003). We compare the substantive data collected within and across the two modes of administration between the in-person only group and the in-person/telephone group to explore the potential unintended consequences of attempts to ease respondent burden through the use of showcards and other interview aids. We draw from prior comparisons of interview modes (Roberts, Jäckle, and Lynn 2007, etc.) to investigate differences associated with telephone and in-person interviewing for questions where showcards were used and where they were not. Summary of Chart types for Scaled Response Options * * Subscript between pairs indicates significant difference at p<.05 * SCALE QUESTIONS – COMPARISONS BETWEEN WAVES LIST QUESTIONS – COMPARISONS BETWEEN MODES AND WAVES * INTRODUCTION * • Making Connections is a neighborhood-based longitudinal survey • Interviews completed in person only in W1, by phone and in person in W2 • Mode in W2 was based on respondent preference i.e. not random • Questions concerning neighborhood engagement, children, income and assets, and perceptions of neighborhood • Approximately 45% of households stayed in the same housing unit in both waves and of those 90% had the same respondent in both waves • Of these households, about half completed a second interview over the phone • Research Questions: • How does this affect responses to scales and questions with many response categories? • Does this make a difference in responses given between waves and for different modes? Neither Agree nor Disagree * * * * Indicates difference is significant at p<.05. Comparisons of differences outlined in chart above. * * * * Positive difference is associated with a higher proportion of Telephone respondents answering yes to the particular category * * * Indicates difference is significant at p<.05 Neither Agree nor Disagree * METHODOLOGY * Positive difference associated with increased proportion of in-person respondents selecting category. Negative difference associated with increased proportion of telephone respondents selecting category. • Identify households • Do not include any households that completed an interview through a proxy, or for which an interview was completed with a non-English speaker without a translated instrument in either wave. • Use households that have not moved between waves and have the same respondent selected in both Waves 1 and 2 (n=2,197) • Compare W1 and W2 responses based on the mode they completed the survey in during Wave 2 (in person or phone) • Analysis of List Questions • Compare the proportion of “yes” responses given for lists of questions that use showcards between respondents interviewed in person and those interviewed by phone in W2 • Calculate differences to identify trends in response patterns • Use binomial tests for significance testing of proportions for “yes” responses for each category in list questions • Using W2 mode categories, compare W1 responses in the same manner to look for similar patterns in responses • Analysis of Scale Questions • Compare the categories selected by respondents interviewed in person and those interviewed by phone in W2 for a variety of questions • Based on observed patterns, collapse responses into two categories • Use binomial tests for significance testing of proportions in the two collapsed categories • Using W2 mode categories, compare W1 responses in the same manner to look for similar patterns in responses * Neither Agree nor Disagree * * * DISCUSSION * Indicates difference is significant at p<.05 Overall, there are response differences between the two groups. However, it is important to note that the interview mode was determined through non-random procedures resulting in selection bias. Because of this, demographic or other factors may be responsible for some of the differences in response patterns between modes. For list questions, mode does not appear to make a substantial difference when taking W1 response patterns into consideration. The differences between proportions of each group responding ‘yes’ to an item may be the result of demographic differences between the two mode groups. With respect to scaled question responses, how showcard use influences the data appears to depend on the particular scale. For questions where all options are listed on the showcard, it seems to encourage selection of ‘longer’ responses among in-person respondents. For other scales, however, in-person respondents selected options that were labeled on the showcards in higher proportions than those interviewed by telephone, who would not be influenced by the visual cues associated with labels on the showcards. Future research based on this preliminary investigation should include models to control for interview mode and demographic variables. As for practical implications, it is possible to build in procedures in subsequent waves where showcards are mailed to respondents in case they complete by phone. However, based on this research, inclusion of certain lists or scales in the showcards may not be beneficial. An experimental design would help to determine how showcards affect response patterns and also help to determine the showcard presentation that best facilitates unbiased data capture. * * * * Indicates difference is significant at p<.05 * Indicates difference is significant at p<.05. Comparisons of differences outlined in chart above.