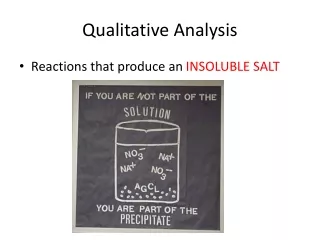
qualitative analysis
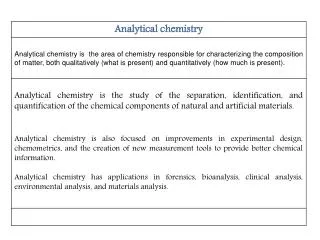
characterization analysis An analysis in which we evaluate a sample’s chemical or physical properties. qualitative analysis An analysis in which we determine the identity of the constituent species in a sample. quantitative analysis An analysis in which we determine how

qualitative analysis
E N D
Presentation Transcript
characterization analysis An analysis in which we evaluate a sample’s chemical or physical properties. qualitative analysis An analysis in which wedetermine theidentity of the constituent species in asample. quantitative analysis An analysis in which we determine how much of a constituent species is present in a sample. fundamental analysis An analysis whose purpose is to improve an analytical method’s capabilities.
a sample is a limited quantity of something which is intended to be similar to and represent a larger amount of that thing(s). • The components of interest in the sample are called analytes, • the remainder of the sample is the matrix. • Techniqueis a chemical or physical principle that canbe used to analyze a sample. • A method is the application of a technique for the determination of a specificanalyte in a specific matrix. • A procedure is a set of written directions detailing how to apply a method to aparticular sample. Constituent : A component of a sample; it may be further classified as: • A major constituent % 1-100 • Minor constituent % 0,01-1 • Trace constituent ˂ %0,01
Statistical Analysis of the Results • Measurement : An experimental determination of ananalyte’s chemical or physical properties. • Measurement data give only an estimate of the ‘true’ value. • Length : • Mass : • Time: • Temperature:
N • ∑ xi • i=1 X1 + X2 +X3 +......+ Xn • X = ------------- = ---------------------------------------- • N N • Mean
xi - xt Er = ------------- . ‰1000 Xt (parts per thousond) xi - xt Er = ----------- . %100 Xt (percentagerelativeerror)
Calculate the mean, median, absolute and relative error for the following data set Fe concentration 19,4ppm 19,5ppm 19,6ppm 19,8ppm 20,1ppm 20,3ppm
Statical Evulation of the Random (indeterminate) Error – (x-μ)2/2 σ2 e y = -------------------------------------- σ (2 П)^ 1/2 x herbir ölçümün değeri μ bir çok ölçümün aritmetik ortalaması x – μortalamadan sapma σstandart sapma yher bir x - μ değeri için bulunma frekansı
Calculate the standard deviation of the following experimental results Lead concentration in blood 0,752ppm 0,756ppm 0,752ppm 0,751ppm 0,760ppm
∑ (xi – x1 )2 + ∑ (xi – x2 )2 + ... Spool = ( --------------------------------------------)^1/2 N1 + N2 + N3 ... – Nt
What are the standard deviation, the relative standard deviation, and thepercent relative standard deviation for the folowing data 3.056 - 3.080 - 3.094 - 3.107- 3.112 - 3.174- 3.198
What are the standard deviation, the relative standard deviation, and thepercent relative standard deviation for the following data 3.056 - 3.080 - 3.094 - 3.107- 3.112 - 3.174- 3.198
1,76 (±0,03) + 1,89 (±0,02 ) - 0,59(±0,02) = ? [ 1,76 (±0,03) x 1,89 (±0,02 ) ] / 0,59(±0,02) =?
The pH of a solution is defined as pH = –log[H+] where [H+] is the molar concentration of H+. If the pH of a solution is 3.72with an absolute uncertainty of ±0.03, what is the [H+] and its absolute uncertainty?
The pH of a solution is defined as pH = –log[H+] where [H+] is the molar concentration of H+. If the pH of a solution is 3.72with an absolute uncertainty of ±0.03, what is the [H+] and its absolute uncertainty?
The Nature and Origin of Errors where μ is the mean and s is the standard deviation. The width of the curve is determined by s, whichis a useful measure of the spread or precision of a set of results, and is unique for that set of data. Aninterval of μ ± s will contain 68.3% of the statistical sample, whilst the intervals μ ± 2s and μ ± 3s willcontain 95.5% and 99.7% respectively. On the basis of their origin, errors may usually be classified as determinate or indeterminate. The firstare those having a value which is (in principle at least) measurable and for which a correction may bemade. The second fluctuate in a random manner and do not have a definite measurable value. Indeterminate errors arise from the unpredictable minor inaccuracies of the individual manipulations ina procedure. A degree of uncertainty is introduced into the result which can be assessed only bystatistical tests. The deviations of a number of measurements from the mean of the measurementsshould show a symmetrical or Gaussian distribution
Confidence Intervals for Populations confidence interval: Range of results around a mean valuethat could be explained by random error. there is a 68.26% probability that amember selected at random from a normally distributedpopulation will have a value in the interval of m ± 1s. In general, we can write Xi = m ± zs where the factor z accounts for the desired level of confidence. Values reportedin this fashion are called confidence intervals.
Confidence intervals also can be reported using the mean for a sample of size n,drawn from a population of known s. The standard deviation for the mean value,s, which also is known as the standard error of the mean
What is the 95% confidence interval for the analgesic tablets if an analysis of five tablets yields a mean of 245 mg of aspirin? the population standard deviation for the amount of aspirin in a batch ofanalgesic tablets is known to be 7 mg of aspirin.
What is the 95% confidence interval for the analgesic tablets if an analysis of five tablets yields a mean of 245 mg of aspirin? the population standard deviation for the amount of aspirin in a batch ofanalgesic tablets is known to be 7 mg of aspirin.
Confidence Intervals for Samples Once the reliability of a replicate set ofmeasurements has been established the mean of the set may becomputed as a measure of the true mean. Unless an infinite number of measurements is made this truemean will always remain unknown. However, the t-factor may be used to calculate a confidenceinterval about the experimental mean, the confidence interval as a way to report the most probablevalue for a population’s mean, m, when the population’s standard deviation, s, is known. Since s2 is an unbiased estimator of s2, the term z in The confidence interval equation is replaced with the variable t, where t is defined such that t ³ z at all confidence levels. t is a statistical factor derived from the normal error curve s is the estimated standard deviation and N is the number of results.
t is a statistical factor derived from the normal error curve s is the estimated standard deviation and nis the number of results.
What is the 95% confidence interval for the folowing data? 3.056 - 3.080 - 3.094 - 3.107- 3.112 - 3.174- 3.198
The accepted value for the chloride content of a standard sample obtained from extensive previousanalysis is 54.20%. Five analyses of the same sample are carried out by a new instrumental procedure, 54.01, 54.24, 54.05, 54.27, 54.11% being the results obtained. For the 95% confidence interval, is the new method giving resultsconsistent with the accepted value?
The accepted value for the chloride content of a standard sample obtained from extensive previousanalysis is 54.20%. Five analyses of the same sample are carried out by a new instrumental procedure, 54.01, 54.24, 54.05, 54.27, 54.11% being the results obtained. For the 95% confidence interval, is the new method giving resultsconsistent with the accepted value?
Dixon’sQ-test.Statistical test for deciding if an outliercan be removed from a set of data.The Q-test compares the difference between the suspected outlier and its nearestnumerical neighbor to the range of the entire data set. outlier: Data point whose value is much larger orsmaller than the remaining data. differencesbetweenoutlierandNearestvalueto it Qexp = ------------------------------------------------------------------------- Range (spread) Qexp is greater than Q(a, n),then the null hypothesis is rejected and the outlier may be rejected. When Qexp is less than or equal to Q(a, n) the suspected outlier must be retained.
The following masses, in grams, were recorded in an experiment to determinethe average mass of a U.S. penny. 3.067 3.049 3.039 2.514 3.048 3.079 3.094 3.109 3.102 Determine if the value of 2.514 g is an outlier at % 90 confidence level.
Tables below show results for two separate experiments to determine themass of a circulating U.S. penny. Determine whether there is a difference in themeans of these analyses at a %95 confidence level.
Tables below show results for two separate experiments to determine themass of a circulating U.S. penny. Determine whether there is a difference in themeans of these analyses at a %95 confidence level.
The %w/w Na2CO3 in soda ash can be determined by an acid–base titration.The results obtained by two analysts are shown here. Determine whether thedifference in their mean values is significant at a %95 confidence level
Comparing Two Sample Variances F-testStatistical test for comparing twovariances to see if their difference is toolarge to be explained by indeterminateerror.The F-test can be extended to the comparison of variances for two samples If Fexp is greaterthan Fcri, the analysis is not under statistical control.
Tables below show results for two separate experiments to determine themass of a circulating U.S. penny. Determine whether there is a difference in theprecisions of these analyses at %95 confidence level. the variances are s2A= 0.00259 and s2B= 0.00138.
A new method for Ni analysis in the stainless stel is being compared with another method, is the new method is acceptable?
the results of the analysis of vitamin B are shown below,. 81,10 79,30 80,40 79,70 Calculate confidence interval for 95% confindence level If the true value 80,00, is there any significant difference between mean values at a %95 confidence level
Sistematik Belirli Hata1- Sabit hatalar : analiz edilen numune miktarından bağımsızdır.2- Orantılı hatalar : numunenin miktarı ile orantılı olarak azalır veya artar
F Testi (standart sapmaların karşılaştırılması) • İki farklı kişinin yaptığı analizlerin veya iki farklı metotla elde edilen sonuçların standart sapmalarının karşılaştırılmasında kullanılır. Farklı sonuçların standart sapmalarının karesi birbirine bölünür ve sonuç tablodaki F değeri ile karşılaştırılır.
Aqueous Solution Chemistry • PrecipitationReactions • Acids, Bases, and Neutralization Reactions • Oxidation–Reduction (Redox) Reactions • Complexformationreactions
Solution Concentrations Mass of solute Percent by mass = ------------------------ x 100 Mass of solution Volume of solute Percent by volume = ------------------------- x 100 Volume of solution Mass of solute Mass / volume percent = --------------------- x 100 (gr/100ml) Volume of solution