Download
1 / 29
290 likes | 432 Vues
Esri Southeast User Conference • Lara Hall • May 5, 2014. SPATIAL ANALYSIS FOR SEA TURTLE CONSERVATION IN GEORGIA. Presentation Outline. Project Introduction Research Objectives Data sets Shrimp Trawler Surveys Sea Turtle Strandings Trawler Boardings Methodology & Results

E N D
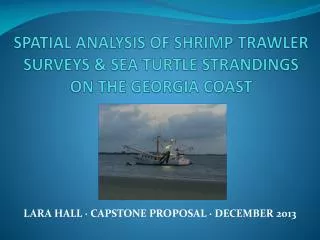
Esri Southeast User Conference • Lara Hall • May 5, 2014 SPATIAL ANALYSIS FOR SEA TURTLE CONSERVATION IN GEORGIA
Presentation Outline • Project Introduction • Research Objectives • Data sets • Shrimp Trawler Surveys • Sea Turtle Strandings • Trawler Boardings • Methodology & Results • Data Preparation • Density Analysis • Distance Analysis • Applications for Research
Shrimp & Sea Turtles Trawling activities by the fishing industry continue to be one of the most common non-natural causes of death for sea turtles, accounting for more than 80% of deaths between 1990 and 2007 (Finkbeiner et al. 2011).
Turtle Excluder Device TED – A Turtle Excluder Device is a grid of metal bars that attaches to a trawl net, creating an opening that allows sea turtles and larger fish to escape. Small animals such as shrimp go between the bars and are caught in the end of the trawl.
Literature Review • Use fleet communication systems to respond to bycatch hotspots • Use predictive modeling to identify areas for closure • Identify environmental factors to predict sea turtle hotspots • Set maximum adult bycatch limits • Reduce size of the fishing fleet • Use strandings to understand the spatial and temporal patterns of the mortality events
Research Objectives • What spatial patterns are present in the location of shrimp trawlers and sea turtle strandings on the Georgia coast? • Do these patterns change as a function of covariates, such as boat size or cause of death? • How have the patterns changed over time? Do they vary with season? • Are sea turtle strandings correlated with shrimping intensity or to TED violations?
Expected Outcomes • Shrimp trawler locations will be clustered and will vary according to season and boat size. • Sea turtle strandings will not be clustered, with the exception of the subset for no apparent injuries. • Both trawler locations and strandings will vary with time. • Strandings from no apparent injuries will correlate with TED violations but not with high shrimp boat density.
Data Available for Analysis • Shrimp Trawler Locations • Sea Turtle Strandings • Boat Boardings and TED Violations
Data: Shrimp Trawler Surveys • Recorded from 1999 to 2012 • A total of 7,906 locations for analysis • Grouped by seasons: early, mid and late • Also categorized by boat size: small, large, and extra-large • Most records fall into the early season and large boat categories
Data: TED Violations • Collected from 2006-2011 • 309 records with 72 violations • For the distance analysis, inland boardings were removed leaving 51 violations out of 196 boardings. • Violations are found on about 25% of the boats boarded.
Methodology & Results • Density Analysis • Kernel Density Estimation (KDE) • Hot Spot Analysis • Distance Analysis
Data Preparation • Create feature classes • Remove records • Create additional fields • Create feature classes from subsets of data • Create study area boundary • Online publication of data to share with colleagues
Kernel Density Analysis Kernel Density Estimation or KDE analysis provides a way to distribute individual counts over the study area to better understand the distribution.
KDE ANALYSIS FOR THE DIFFERENT SHRIMP SEASONS Density Analysis
KDE ANALYSIS FOR THE DIFFERENT BOAT SIZES Density Analysis
KDE ANALYSIS FOR THE PROBABLE CAUSE OF STRANDINGS Density Analysis
Hot Spot Analysis Hot Spot Analysis provides a way to identify statistically significant clustering for events with a count field.
HOT SPOT ANALYSIS FOR TRAWLER SURVEYS AND ALL STRANDINGS Density Analysis
HOT SPOT ANALYSIS FOR PROBABLE CAUSE OF STRANDINGS Density Analysis
Distance Analysis: Near Tool The Near tool identifies the closest target feature and calculates the distance for each record in a dataset.
Statistical Model • Bayesian hierarchical logistic model • Calculated the relative probability of stranding near the predictor variables • Variables included the nearest trawler observation, the above average fishing locations, and the TED violations
Model Builder to Create a Custom Tool The custom tool ran the Near tool, created new fields and populated the fields for each step of the distance analysis.
Statistical Model Results All Sea Turtles with No Apparent Injuries Loggerheads with No Apparent Injuries For all probable death categories, there was a significant negative relationship between being stranded and the nearest TED violation.
Application of Results • Strengthen the argument for TED regulations and compliance • Density maps will identify areas to target for trawler boardings through the shrimping season • Confirm the importance of collecting accurate spatial data for events impacting sea turtle conservation • Additional analysis to look at correlation at different spatial scales and potential natural causes of the strandings hotspots on the southern islands
Thank you to all of the agencies supporting this research. QUESTIONS?