(a)
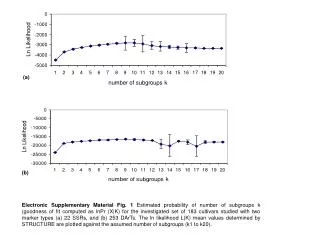
This figure presents the estimated probability of the number of subgroups (k) as computed through the goodness of fit via the natural logarithm of the probability function (lnPr(X|K)) for a set of 183 cultivars evaluated with two marker types: 22 SSRs and 253 DArTs. The mean ln-likelihood values (L(K)), as determined by the STRUCTURE software, are plotted against the assumed number of subgroups, ranging from k=1 to k=20. This analysis aids in understanding the population structure and diversity of the investigated cultivars.

(a)
E N D
Presentation Transcript
(a) (b) Electronic Supplementary Material Fig. 1 Estimated probability of number of subgroups k (goodness of fit computed as lnPr (X|K) for the investigated set of 183 cultivars studied with two marker types (a) 22 SSRs, and (b) 253 DArTs. The ln likelihood L(K) mean values determined by STRUCTURE are plotted against the assumed number of subgroups (k1 to k20).